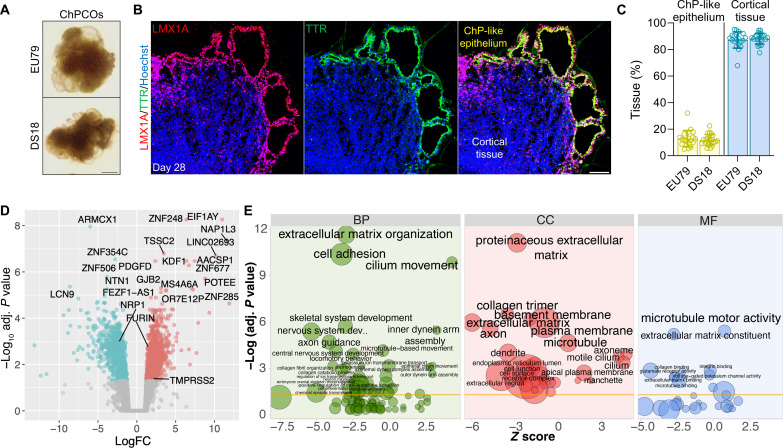
Fig. 6. Transcriptional profile of ChPCO modeling DS.
(A) Representative bright-field images of euploid- and DS-iPSC–derived ChPCOs on day 28. Scale bar, 500 μm. (B) Representative image of euploid-iPSC–derived ChPCOs on day 28 immunostained with LMX1A (red) and TTR (green). The section was counterstained with Hoechst 33342 (blue). Scale bar, 100 μm. (C) Quantification of ChP-like epithelium and cortical tissues compartments in at least three different euploid (EU79) and DS (DS18) hiPSC-derived ChPCOs. Individual dots represent a single organoid. Total number of experiments = 8; total number of analyzed organoids = 29. The number of organoids analyzed and the number of experiments from each time point are summarized in table S8. (D) Volcano plot highlighting DEGs in euploid and DS ChPCOs on day 28. Significant up-regulated genes are shown in red, and down-regulated genes are shown in cyan. Top-most DEGs as well as TMPRSS2, FURIN, and NRP1 genes are labeled. (E) Gene ontology (GO) enrichment analysis of differentially expressed genes (DEGs) in DS ChPCOs compared to euploid organoids. Z scores indicate the cumulative increase or decrease in expression of the genes associated with each term. Size of the bubbles is proportional to the number of DEGs associated with respective GO term. BP, biological processes; CC, cellular components; MF, molecular functions.

