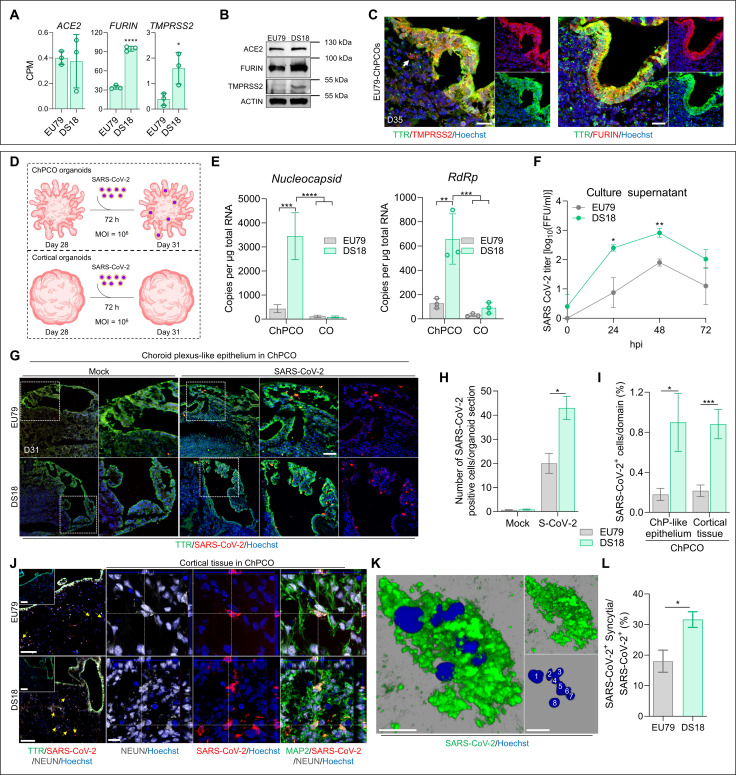
Fig. 8. SARS-CoV-2 productively infects ChPCO but not CO organoids.
(A) Abundance of ACE2-, FURIN-, and TMPRSS2-derived RNA-seq reads in day 31 ChPCOs. Data are means ± SD. *P < 0.05, ****P < 0.0001 via Student’s t test. N = 3. (B) Western blots showing the levels of ACE2, FURIN, TMPRSS2, and ACTIN in day 31 ChPCOs. (C) Section of euploid ChPCOs stained with TMPRSS2 (red), FURIN (red), and TTR (green) and counterstained with Hoechst 33342. Scale bar, 20 μm. (D) Schematic diagram of the SARS-CoV-2 infection protocol. (E) Graphs showing SARS-CoV-2 nucleocapsid and RdRp in day 31 organoids. Data are means ± SD. **P < 0.01, ***P < 0.001, ****P < 0.0001 via two-way ANOVA. N = 3. (F) Viral titers from ChPCO supernatants after SARS-CoV-2 (106 FFUs) treatment. Data are means ± SEM. N = 3; *P < 0.05, **P < 0.01 via Student’s t test. (G) ChPCO sections stained with TTR (green) and SARS-CoV-2 spike (red) after SARS-CoV-2 (106 FFUs) or mock (SARS-CoV-2 at 104 FFUs) and counterstained with Hoechst 33342. Scale bar, 60 μm. (H) Graph showing the SARS-CoV-2–positive cells in ChPCOs. Data are means ± SEM. *P < 0.05 via Student’s t test. Fifteen ChPCO sections from n = 3. (I) Graph showing the percentages of SARS-CoV-2–positive cells within ChPCOs. Data are means ± SEM. *P < 0.05, ***P < 0.001 via Student’s t test. Fifteen ChPCO sections from n = 3. (J) ChPCO sections stained with TTR (green), SARS-CoV-2 spike (red), and NEUN (gray). Scale bar, 100 μm. Orthogonal projections are confocal z-stacks stained with MAP2 (green), SARS-CoV-2 nucleocapsid (red), and NEUN (gray) and counterstained with Hoechst 33342. Scale bar, 10 μm. Yellow arrows indicate infected neurons. (K) 3D-reconstruction SARS-CoV-2–positive syncytia with maximum Z-plane projection. White numbers mark individual nucleus. Scale bar, 10 μm. (L) Graph showing the percentage of SARS-CoV-2–positive syncytia after 72 hpi. Data are means ± SEM. *P < 0.05 via Student’s t test. Fifteen ChPCO sections from n = 3.

