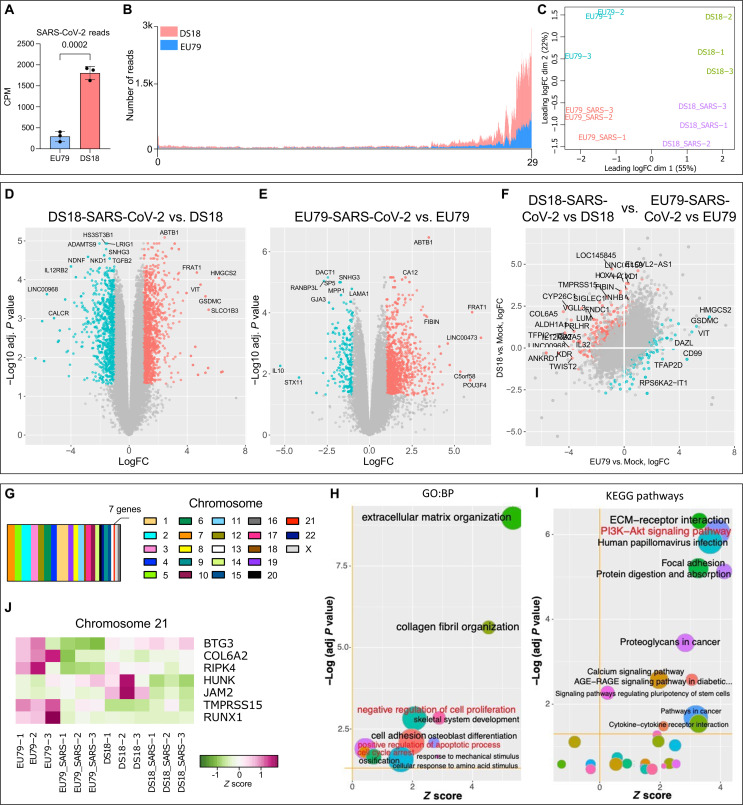
Fig. 9. Transcriptional analysis in euploid and trisomy 21 ChPCOs upon SARS-CoV-2 infection.
(A) Abundance of SARS-CoV-2–derived RNA-seq reads in euploid (EU79) and DS (DS18) ChPCOs. Read counts were normalized to the library sizes. Error bars indicate SD. Statistical analysis was performed by Student’s t test. (B) Distribution of SARS-CoV-2–derived RNA-seq reads across viral genome. Data for DS (DS18) ChPCOs are shown in red, and euploid (EU79) ChPCOs are in blue. (C) Distribution multidimensional scaling analysis of RNA-seq read counts derived from uninfected and SARS-CoV-2–infected human ChPCOs of euploid (EU79) and DS (DS18). (D and E) Volcano plots highlight DEGs in SARS-CoV-2–infected DS (D) and euploid (E) ChPCOs compared to mock. (F) Scatterplot indicating the differences in SARS-CoV-2–induced gene expression changes between DS18 and EU79 ChPCOs. In (D) to (F), the significantly (FDR-adjusted P < 0.05) up- and down-regulated genes with at least twofold change in expression levels are shown in red and cyan, respectively. Most DEGs are labeled. (G) Distribution of the SARS-CoV-2–responsive DEGs identified in (F) across individual chromosomes. (H) GO and (I) KEGG pathway enrichment analysis of DEGs in (F). Z scores indicate the cumulative increase or decrease in expression of the genes associated with each term. Size of the bubbles is proportional to the number of DEGs associated with respective GO term. (J) Expression of the chromosome 21–associated genes identified in (F) in SARS-CoV-2–infected and uninfected DS18 and euploid (EU79) ChPCOs.

