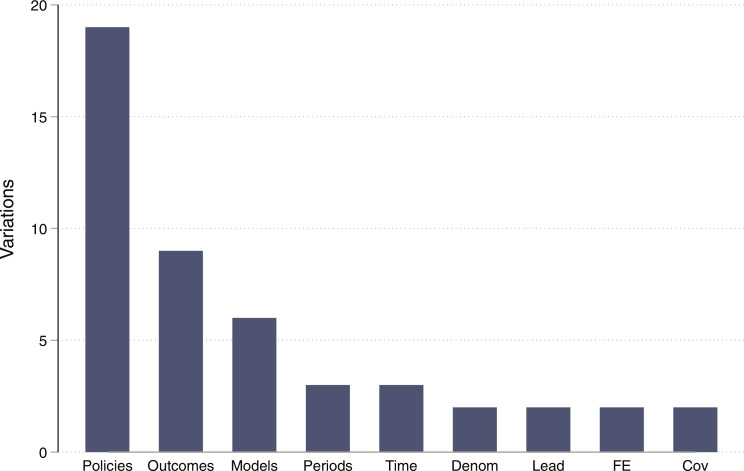
Fig. 1. Analysis and data variations.
The product of all the variations (147,744)—19 response types (policies), 9 outcomes, 6 models, 3 time periods, 3 time aggregations, 2 denominators, 2 leads, 2 fixed effects, and 2 covariates—is greater than the number of models actually run (99,736). This is because some combinations were not feasible or reasonable. For example, only one lead (1 month) was used when the dataset was aggregated at the monthly level.

