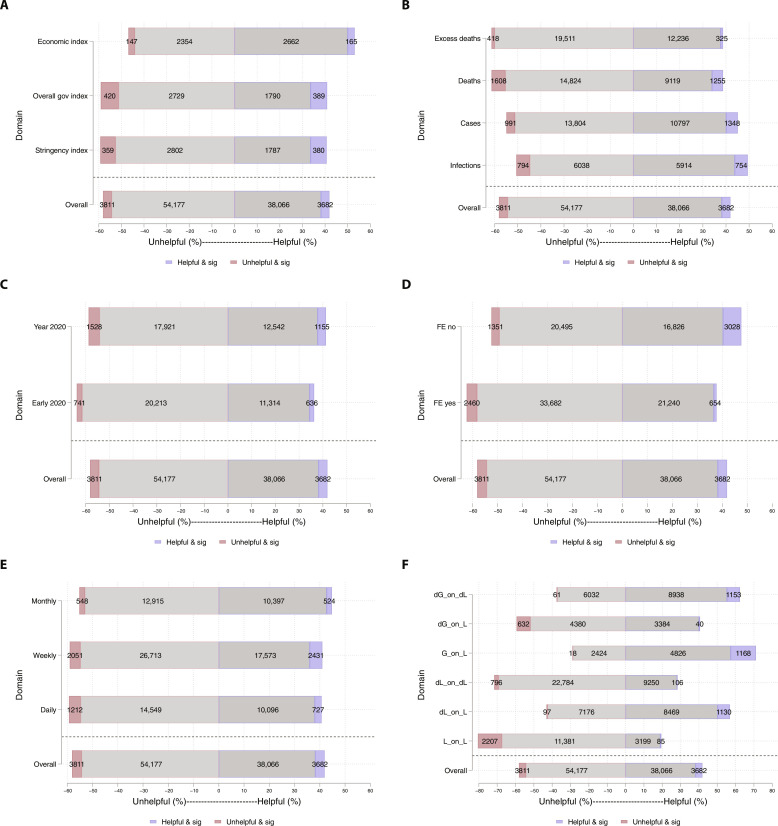
Fig. 2. Portion of models with point estimates in the helpful or unhelpful direction, by group.
The portion of models with helpful and unhelpful associations, by domain. Each panel includes the overall distribution of effects (bottom bar), and the models that were significant (solid colors). Panel (A) shows the distribution for each of the three government response indices, panel (B) for the four outcome types (cases, infections, COVID-19 deaths, and all-cause excess deaths), panel (C) for the three study periods, panel (D) for models with and without fixed effects, panel (E) for the three time aggregations, and panel (F) for the six models (1 bottom, 6 top). The models are indexed as L (levels) or G (growth), with d indicating a difference.

