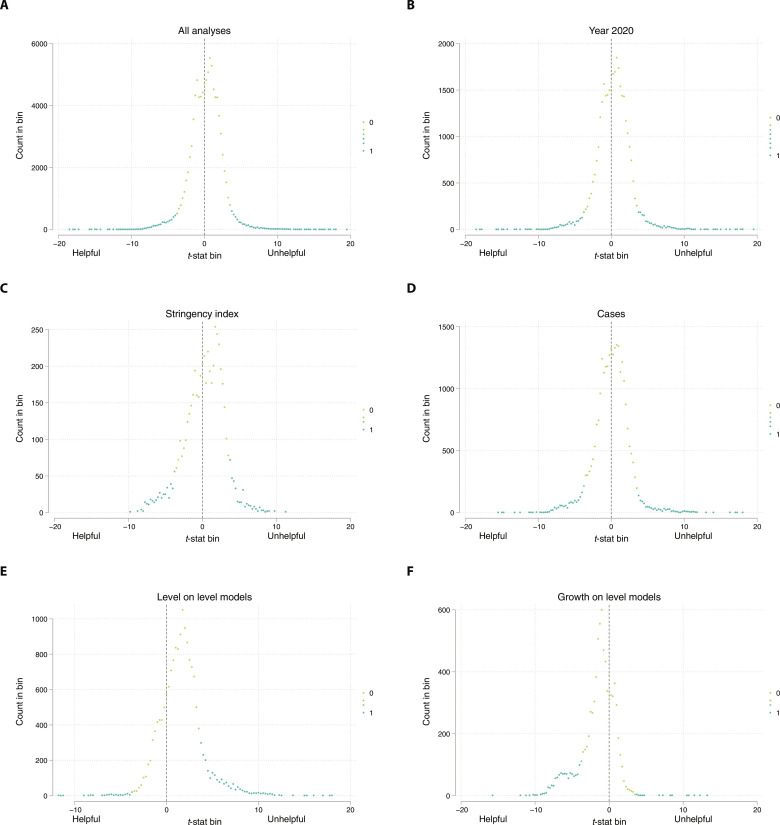
Fig. 3. Distribution of standardized effect sizes for all analyses and selected groups.
The t-statistics are used as a proxy for the standardized effect size of different models. The count of models with t-statistics in each interval [x, x + 0.25) for x ranging from −20 to +20 is shown in each panel (intervals with 0 models are not shown). The portion of the models that are significant using the false discovery rate is represented by the shade. In (A), for example, the t-statistic interval with the largest count of models is between 0.75 and 1.00. None of those models are significant. Panel (A) includes all models; (B) includes models for the year 2020; (C) includes models with the stringency index as the predictor; (D) includes models with cases as the outcome; (E) includes models designed to assess the relationship between the policy level and the outcome level (model 1); and panel (F) includes models designed to assess the relationship between the policy level and the change (growth) in the outcome (model 4).

