
Fig. 4.
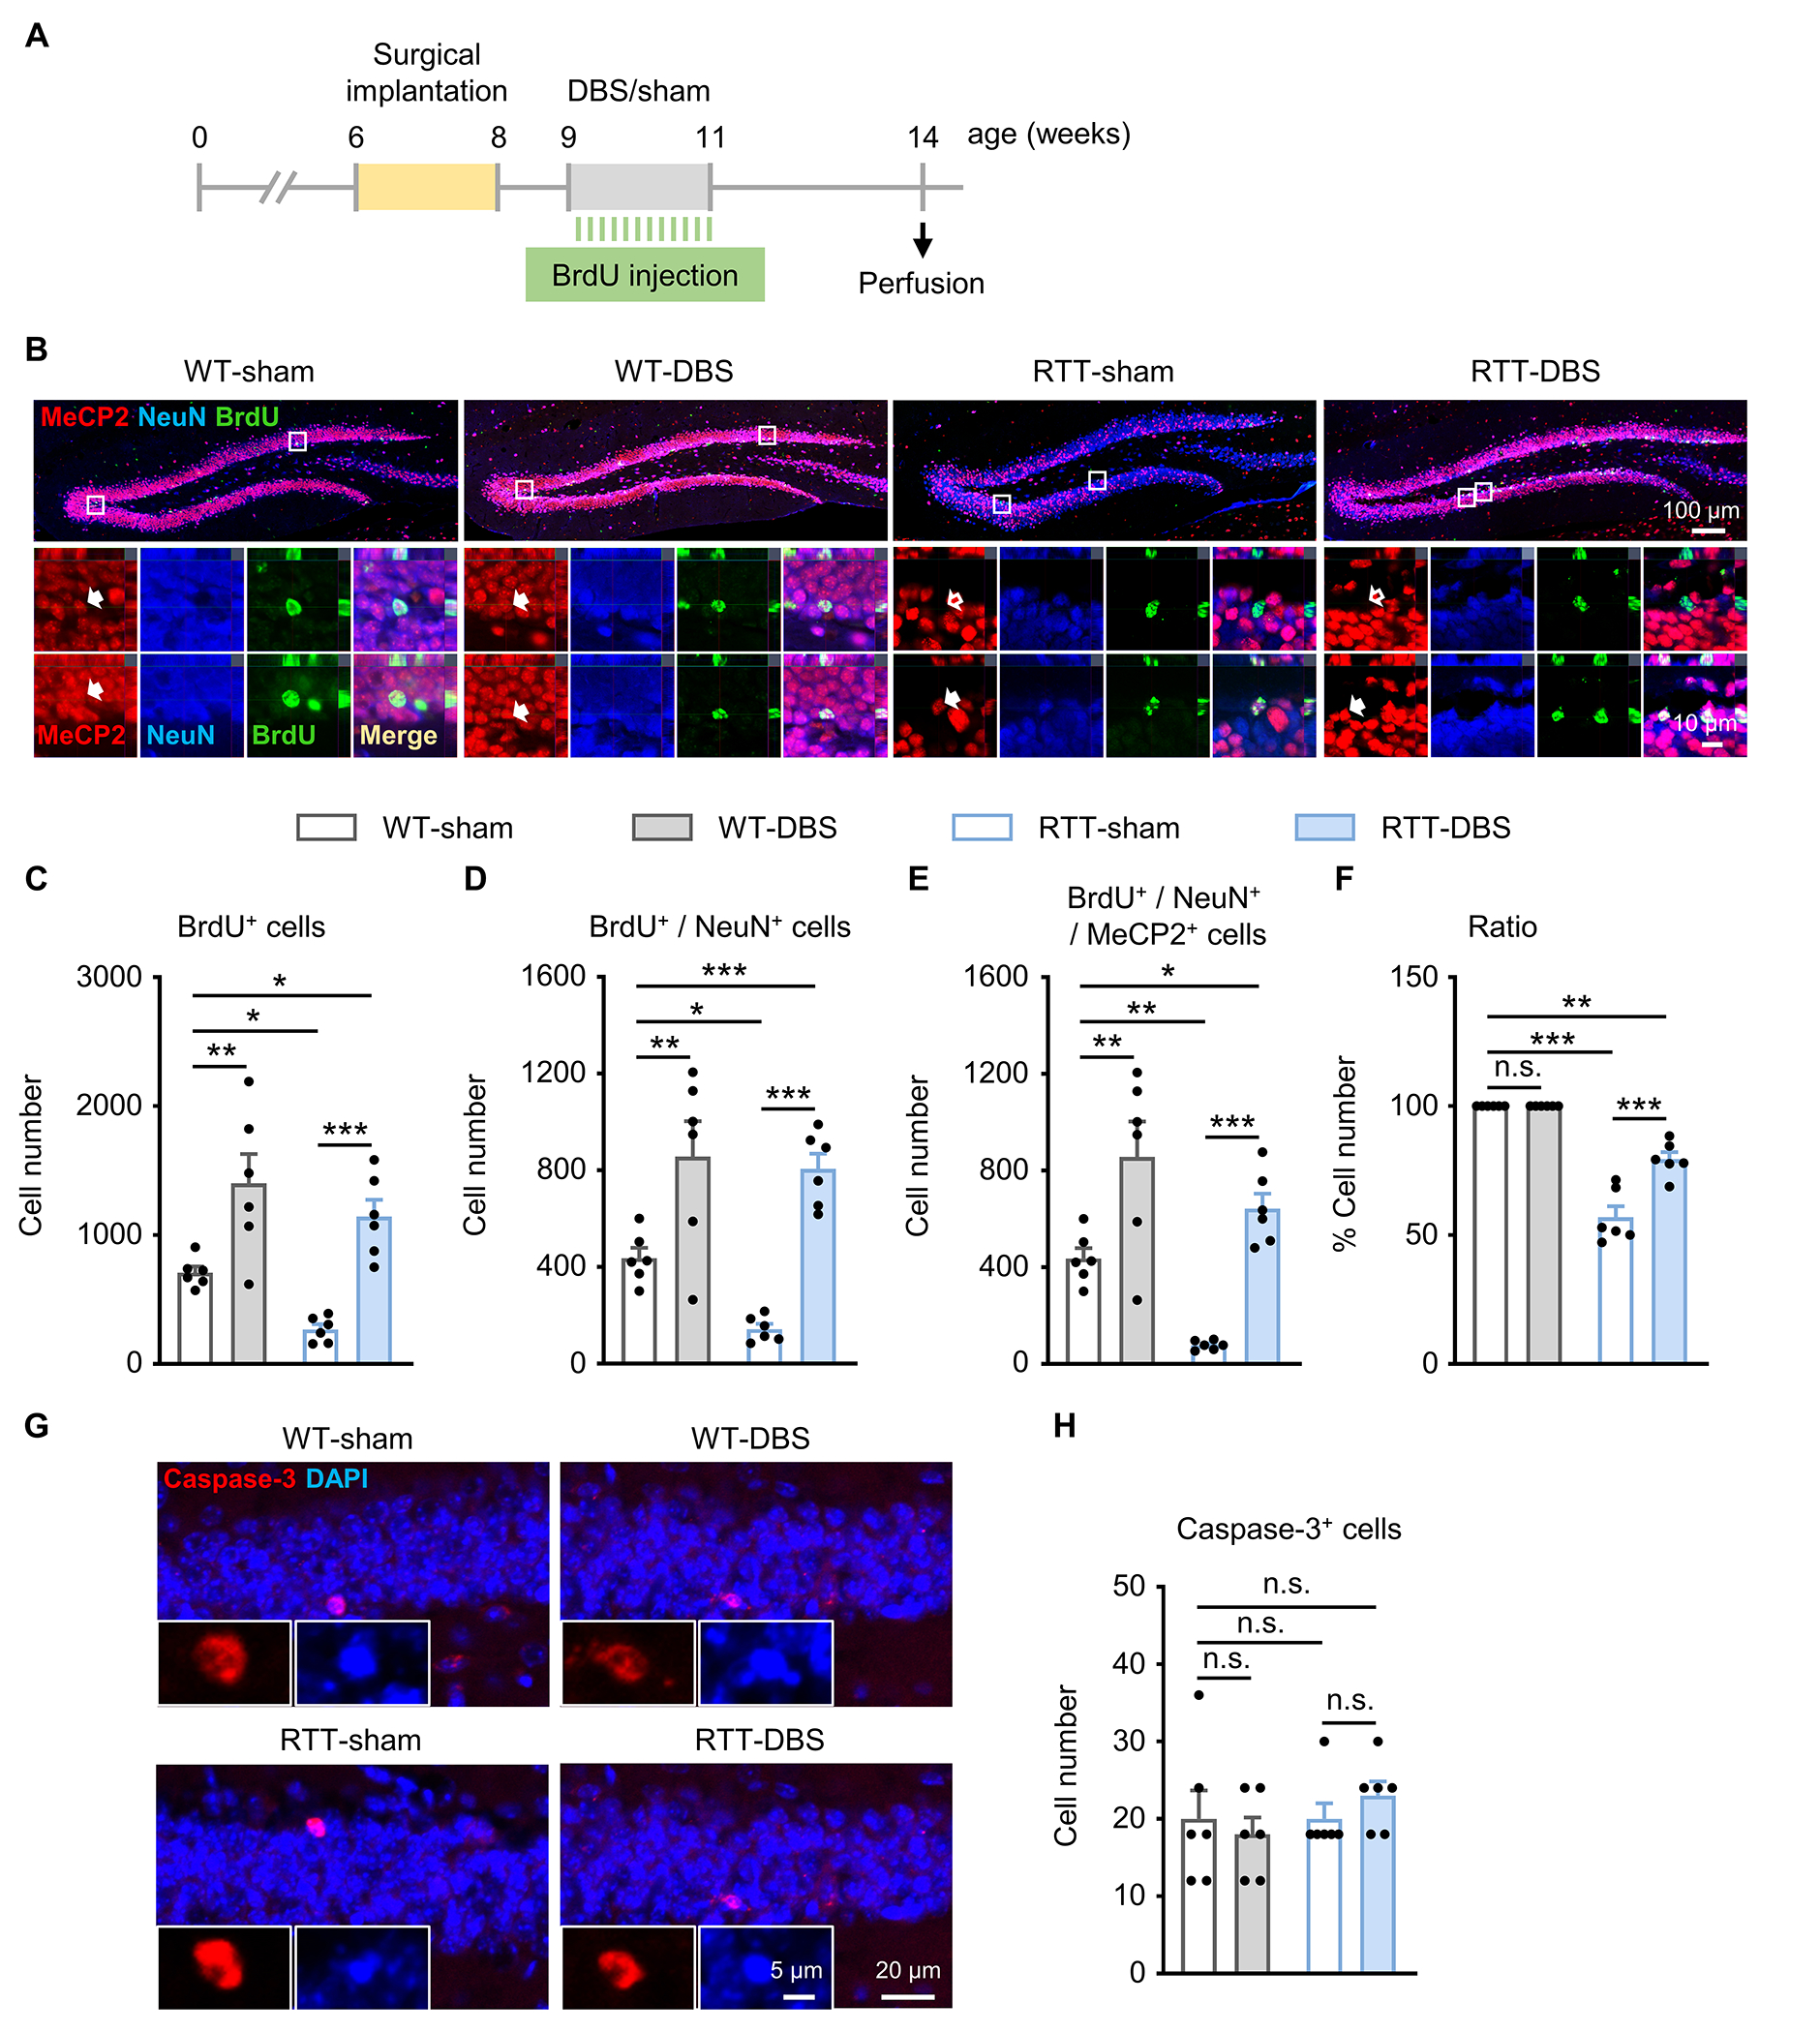
Forniceal DBS induces birth of more MeCP2+ than MeCP2−DGCs without affecting neuronal survival in RTT mice. (A) Experimental timeline. (B) Representative images at low (top) and high (bottom) magnification showing MeCP2+ cells (red), NeuN + cells (blue), BrdU+ cells (green), and the merge (yellow) from each of the four groups. Filled arrow, MeCP2+ cells; empty arrow, MeCP2−cells. (C, D, E, F) Summary of immunoreactive cell counting (n = 6 mice per group). Two-way ANOVA followed by Tukey post hoc revealed a significant main effect on the numbers of BrdU+ cells (C, genotype, F1,20 = 6.680, p = 0.018; treatment, F1,20 = 33.761, p < 0.001), BrdU+ / NeuN+ cells (D, genotype, F1,20 = 4.263, p = 0.052; treatment, F1,20 = 42.171, p < 0.001), BrdU+ / NeuN+ / MeCP2+ cells (E, genotype, F1,20 = 11.999, p = 0.002; treatment, F1,20 = 35.509, p < 0.001), and the ratio of BrdU+ / NeuN+ / MeCP2+ cells over total BrdU+ / NeuN+ cells (F, genotype, F1,20 = 160.717, p < 0.001; treatment, F1,20 = 20.208, p < 0.001). (G) Representative images stained with caspase-3 (red) and DAPI (blue) in the dentate gyrus. Inset, caspase-3 positive cells at higher magnification. (H) Number of caspase-3 positive cells in each of the 4 study groups (n = 6 mice per group). Two-way ANOVA followed by Tukey post hoc: genotype, F1,20 = 0.969, p = 0.337; treatment, F1,20 = 0.039, p = 0.846. *p < 0.05, **p < 0.01, ***p < 0.001. n.s., not significant. Data presented as mean ± SEM with individual values.