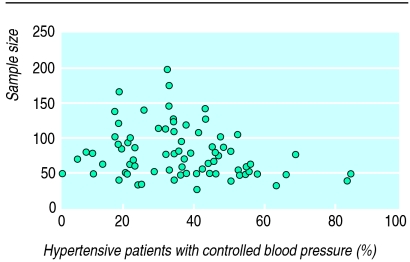
Figure.
Funnel plot showing proportion of hypertensive patients with controlled blood pressure and sample size used in each practice. The spread of the proportions is largest when the sample size is low. Detailed analysis of the variance indicates that a sample size of 200 is needed to discriminate reliably between practices

