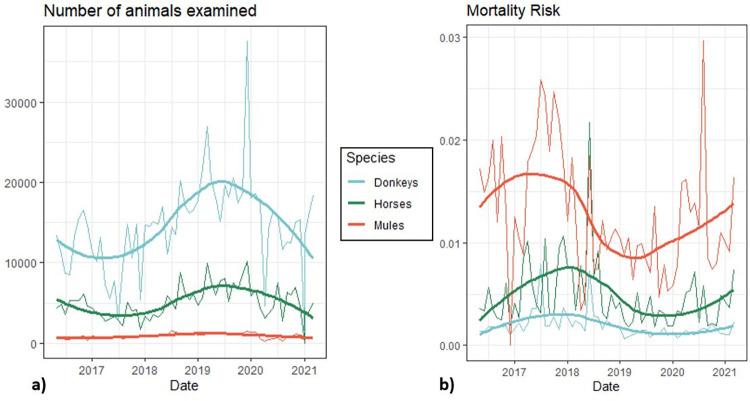
Fig 2.
Number of animals seen per species per year in all countries included in retrospective data analysis of clinical findings of working equids in low- and middle-income countries presenting to an international NGO between May 2016 and March 2021 (a)); and mortality risk (proportion) of species in relation to the overall number of animals presented per species per year (b)). An outlier in horse mortality risk during January 2021 has been removed from plot b) for visualization purposes. Solid curve lines generated with geom_smooth() function and LOESS smoother method in R 4.2.1.

