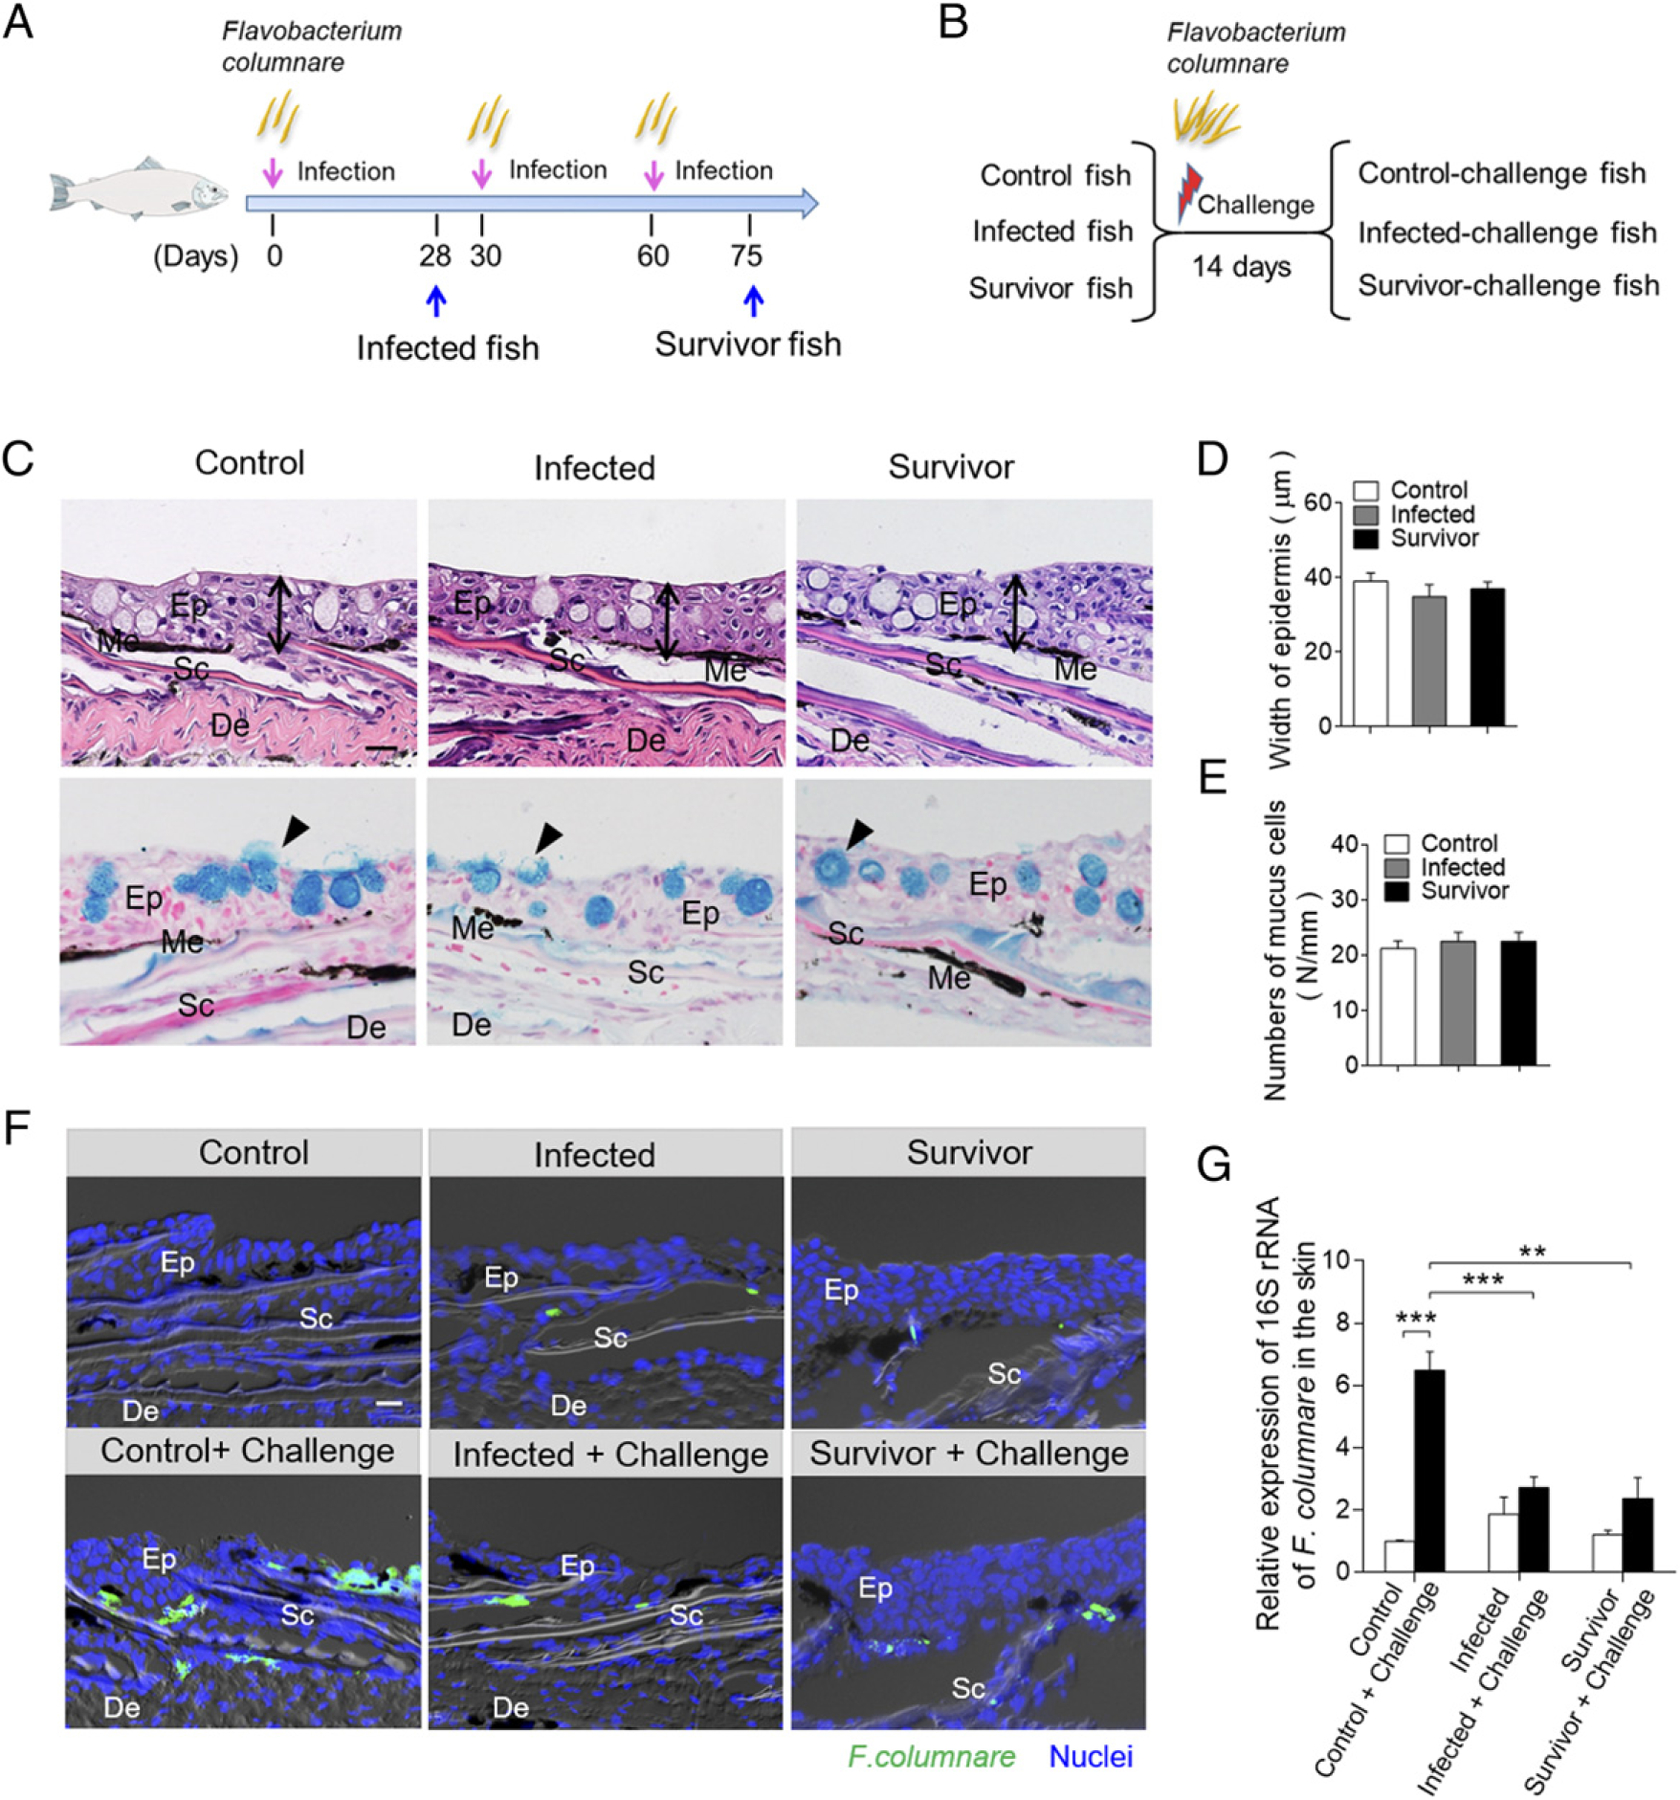
FIGURE 3.

Bacterial load of the skin from survivor fish upon F. columnare reinfection. (A) Scheme of the strategy of infection with F. columnare to obtain infected and survivor group fish. (B) The fish from control (previously uninfected), infected, and survivor fish were challenged with a high dose of F. columnare. (C) Histological examination by H&E and AB staining of skin from fish infected for 28 d and survivor fish (n = 6). The black lines with double arrows and black triangle indicate the width of skin epidermis and the mucus-secreting cells, respectively. Scale bar, 20 μm. (D) The width of skin epidermis of control fish, infected fish, and survivor fish counted from (A) (upper) (n = 6). (E) The number of mucus cells per millimeter in the epidermis of trout skin from control, infected, and survivor fish counted from (A) (lower) (n = 6). (F) Differential interference contrast images of fluorescence analysis showed the GFP–F. columnare location and load in the skin from control and control-challenge fish (left), 28-d-infected and 28-d–infected-challenge fish (middle), and survivor fish and survivor-challenge fish (right). These challenge fish were sampled at 4 d after reinfection with GFP–F. columnare (n = 6). Scale bar, 20 μm. (G) The relative expression of 16S RNA of F. columnare in the trout skin tissue of control, control-challenge, infected, infected-challenge, survivor, and survivor-challenge group were measured by qRT-PCR (n = 6 fish per group). Data are representative of at least three independent experiments (mean ± SEM). **p < 0.01, ***p < 0.001, unpaired Student t test. De, dermis; Ep, epidermis; Me, melanophores; Sc, scale.
