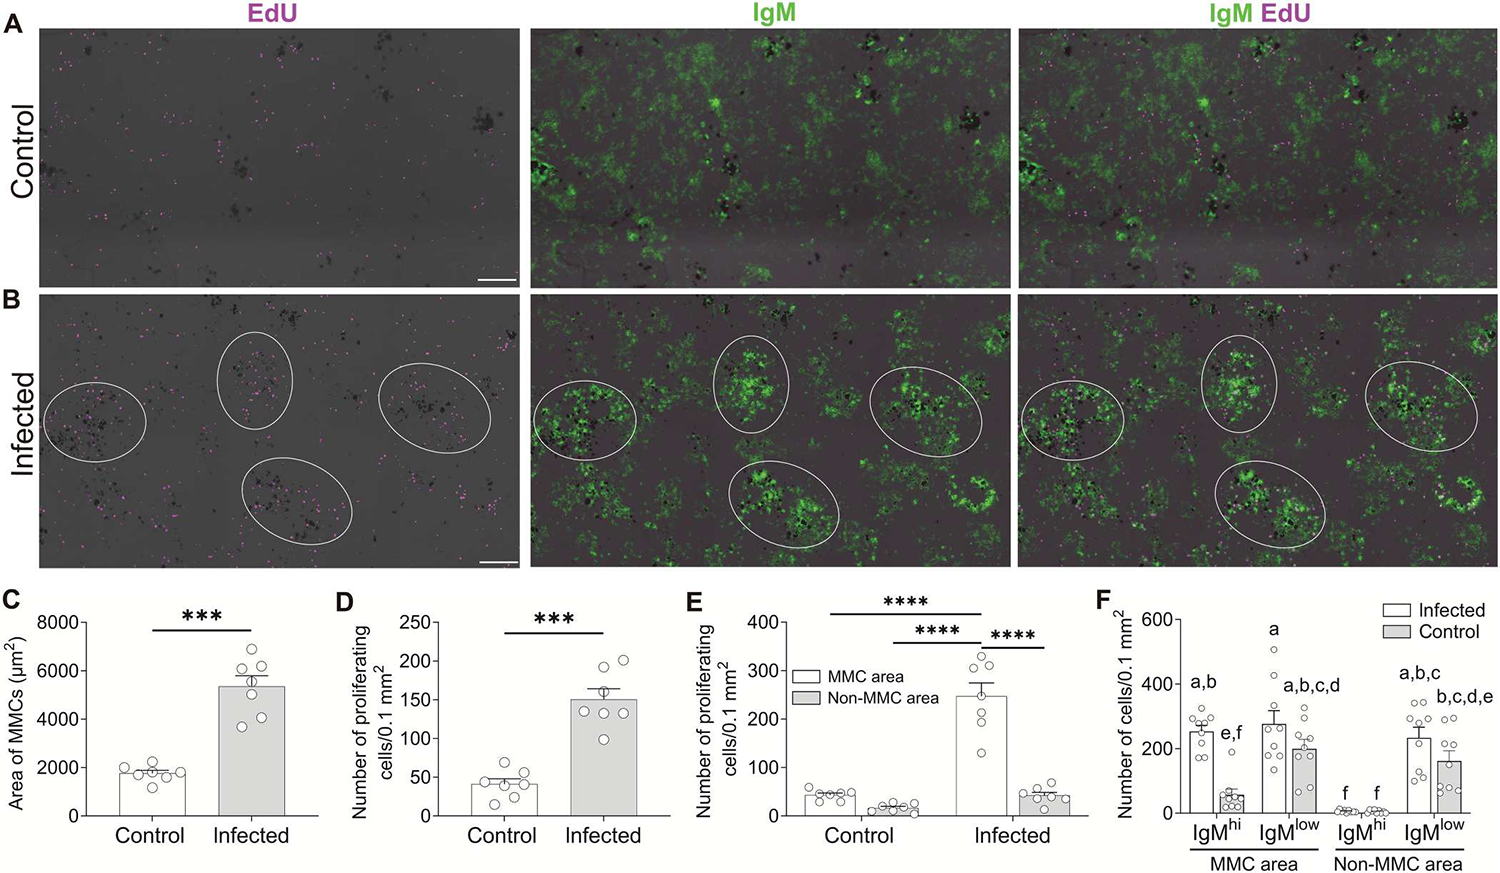
Fig. 1. Intense IgM+ B cell proliferation occurs near splenic MMCs upon infection.

(A and B) IF analysis of EdU incorporation by cells of spleens from control (A) or infected fish (B). Spleen cryosections were stained for EdU (magenta) and IgM (green). Groups of dark cells in all images represent MMCs. White circles in (B) outline MMC-adjacent areas with high cell proliferation. Scale bars, 100 μm. (C and D) Area of MMCs, defined as the total surface of melanomacrophages (C) and number of proliferating cells (D) calculated from spleen cryosections of control or infected fish (n = 7). (E) Number of proliferating cells in MMC and non-MMC areas of spleen cryosections from control or infected fish (n = 7). (F) Number of IgMhi and IgMlow B cells in MMC and non-MMC areas of spleen cryosections from control or infected fish (n = 9). Data in (C) to (F) are representative of at least three independent experiments (means and SEM). Empty circles represent values from individual fish. Statistical analyses were performed by unpaired Student’s t test (C and D) or two-way ANOVA, followed by Tukey’s post hoc test (E and F). ***P < 0.001 and ****P < 0.0001. Plot bars of (F) not sharing common letters are significantly different (P < 0.05).
