. 2024 Jun 4;12:RP92189. doi: 10.7554/eLife.92189

Figure 1. The recruitment of STX17 to autophagosomes is dependent on its positively charged C-terminal region.

(A) Schematic representation of the structures of STX17 and its C-terminal variants. The positively (orange) and negatively (blue) charged residues are shown. Alanine substitutions are shown in green. TMH, transmembrane helix; CTR, C-terminal region. (B) Schematic representation of the localization of ATG5, LC3B, and STX17 during autophagosome formation and maturation. (C–E) Mouse embryonic fibroblasts (MEFs) stably expressing mRuby3-LC3B and GFP–STX17TM (containing the two transmembrane helices and the C-terminal region) or its mutants were cultured in starvation medium for 1 hr. Quantification of GFP–STX17TM intensity of mRuby3–LC3B-positive ring-like structures (n>30) are shown in the graphs. In box plots, solid horizontal lines indicate medians, boxes indicate the interquartile ranges (25th to 75th percentiles), whiskers indicate the 5th to 95th percentiles, and dots represent outliers. Differences were statistically analyzed by Welch’s t-test (C) or one-way ANOVA followed by Dunnett’s multiple comparison test (D and E). Experiments were performed three times independently. Scale bars, 10 μm (main), 1 μm (inset) (C, D, and E).

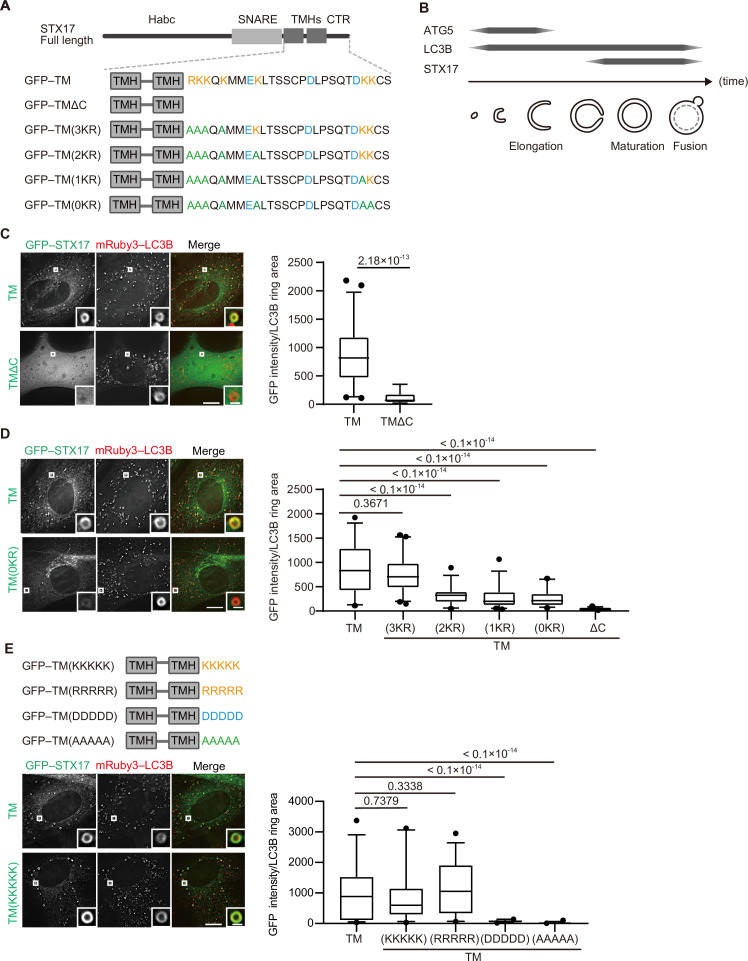
Figure 1—source data 1. Data used for graphs presented in Figure 1C, D and E and Figure 1—figure supplement 1B.

Figure 1.

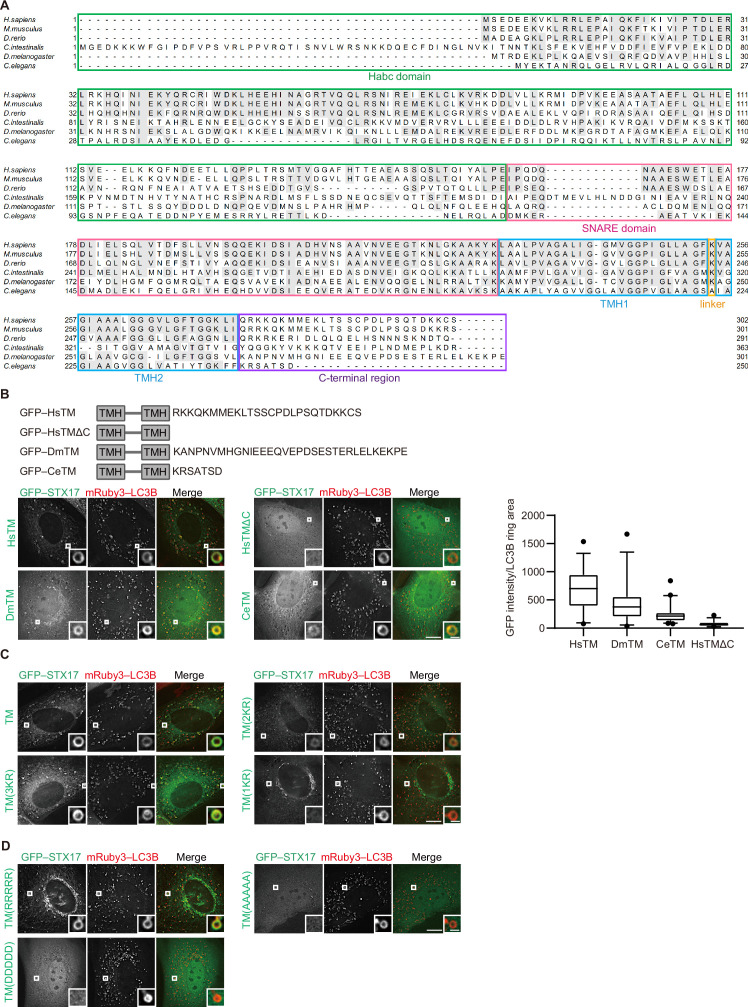
Figure 1—figure supplement 1. Recruitment of STX17 depends on the abundance of cationic amino acids in the C-terminal region but not on its specific amino acid sequence.

Figure 1—figure supplement 1.

(A) Multiple sequence alignment of STX17 proteins from Homo sapiens (Hs), Mus musculus, Danio rerio, Ciona intestinalis, Drosophila melanogaster (Dm), and Caenorhabditis elegans (Ce). Identical residues between more than two species are indicated with gray boxes. Domains of STX17 are indicated with different colors: green, the Habc domain; magenta, the SNARE domain; blue, transmembrane helix (TMH); orange, a linker between the TMDs; and purple, the C-terminal region. (B) Mouse embryonic fibroblasts (MEFs) stably expressing mRuby3–LC3B and either GFP-tagged HsSTX17TM, DsSTX17TM, or CeSTX17TM were cultured in starvation medium for 1 hr. GFP–STX17TM intensities of mRuby3–LC3B-positive ring-like structures were quantified (n>30). In box plots, solid horizontal lines indicate medians, boxes indicate the interquartile ranges (25th to 75th percentiles), whiskers indicate the 5th to 95th percentiles, and dots represent outliers. (C) MEFs stably expressing one of the GFP-tagged alanine replacement mutants (shown in Figure 1A) and mRuby3–LC3B were cultured in starvation medium for 1 hr. Quantification results are shown in Figure 1D. (D) MEFs stably expressing one of the GFP-tagged charge replacement mutants (shown in Figure 1E) and mRuby3–LC3B were cultured in starvation medium for 1 hr. Quantification results are shown in Figure 1E. Experiments were performed three times independently. Scale bars, 10 μm (main), 1 μm (inset) (B, C, and D).