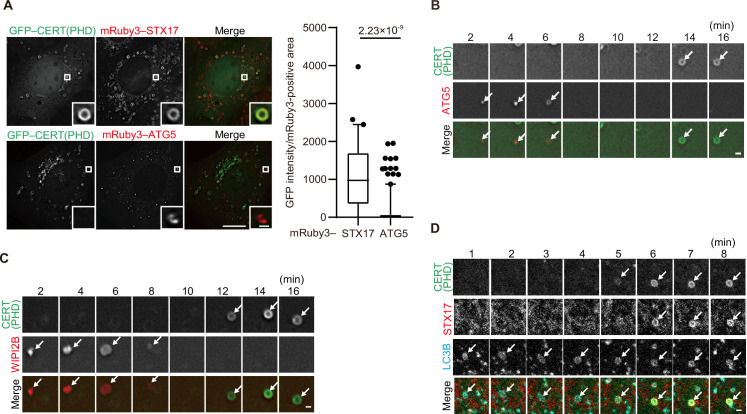
Figure 3. Phosphatidylinositol 4-phosphate (PI4P) is enriched in the autophagosomal membrane during maturation.
(A) Mouse embryonic fibroblasts (MEFs) stably expressing GFP–CERT(PHD) and mRuby3–STX17TM or mRuby3–ATG5 were cultured in starvation medium for 1 hr. GFP intensities of mRuby3-positive structures (n>60) were quantified. In box plots, solid horizontal lines indicate medians, boxes indicate the interquartile ranges (25th to 75th percentiles), whiskers indicate the 5th to 95th percentiles, and dots represent outliers. Differences were statistically analyzed by Welch’s t-test. (B–D) Time-lapse analysis of MEFs stably expressing GFP–CERT(PHD) and mRuby3–ATG5 (B), WIPI2B–mRuby3 (C), or mRuby3–STX17TM and HaloTag–LC3B (visualized with SaraFluor 650T HaloTag ligand) (D) cultured in starvation medium. Autophagosomes are indicated by arrows. Experiments were performed three times independently. Scale bars, 10 μm (A [main]), 1 μm (A [inset], B–D).


