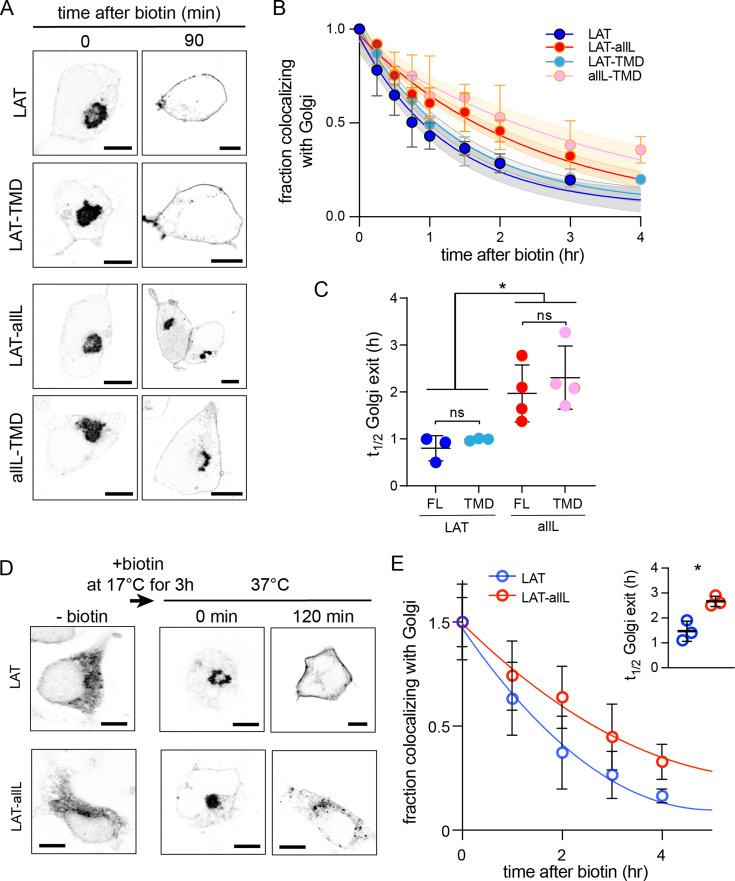
Figure 3. Golgi exit kinetics of LAT are dependent on its association with raft domains.
(A) Representative confocal images of Golgi RUSH experiment show notable Golgi retention of non-raft constructs (LAT-allL and allL-TMD) after 90 min of biotin addition, in contrast to raft-preferring LAT and LAT-TMD. (B) Temporal reduction of protein constructs remaining in Golgi after biotin addition (i.e. release from Golgi RUSH), quantified by immunostaining and colocalization with Golgi marker (Giantin, see Figure 3—figure supplement 2). Symbols represent average +/-st.dev. from three independent experiments with >15 cells/experiment. Fits represent exponential decays; shading represents 95% confidence intervals. (C) Golgi exit rates for raft-associated LAT constructs are ~2.5-fold faster than non-raft versions for both full-length and TMD-only. Points represent t1/2 values from fits of independent repeats with >20 cells/experiment. *p<0.05, nsp >0.05. (D) Representative confocal images of full-length LAT and LAT-allL during Golgi temperature block. Addition of biotin at 17 °C releases ER-RUSH constructs but traps them in Golgi. Removing temperature block by incubation at 37 °C leads to fast PM trafficking of LAT but not non-raft LAT-allL. (E) Fraction of proteins in Golgi for the constructs shown in D, calculated as in B. Fits represent exponential decays. (inset) Golgi exit kinetics quantified as in C. All scale bars = 5 μm. Original data quantification can be found in the Source Data files.


