
Figure 1. 5-HT bi-directionally regulates the coincidence time window of olfactory learning.
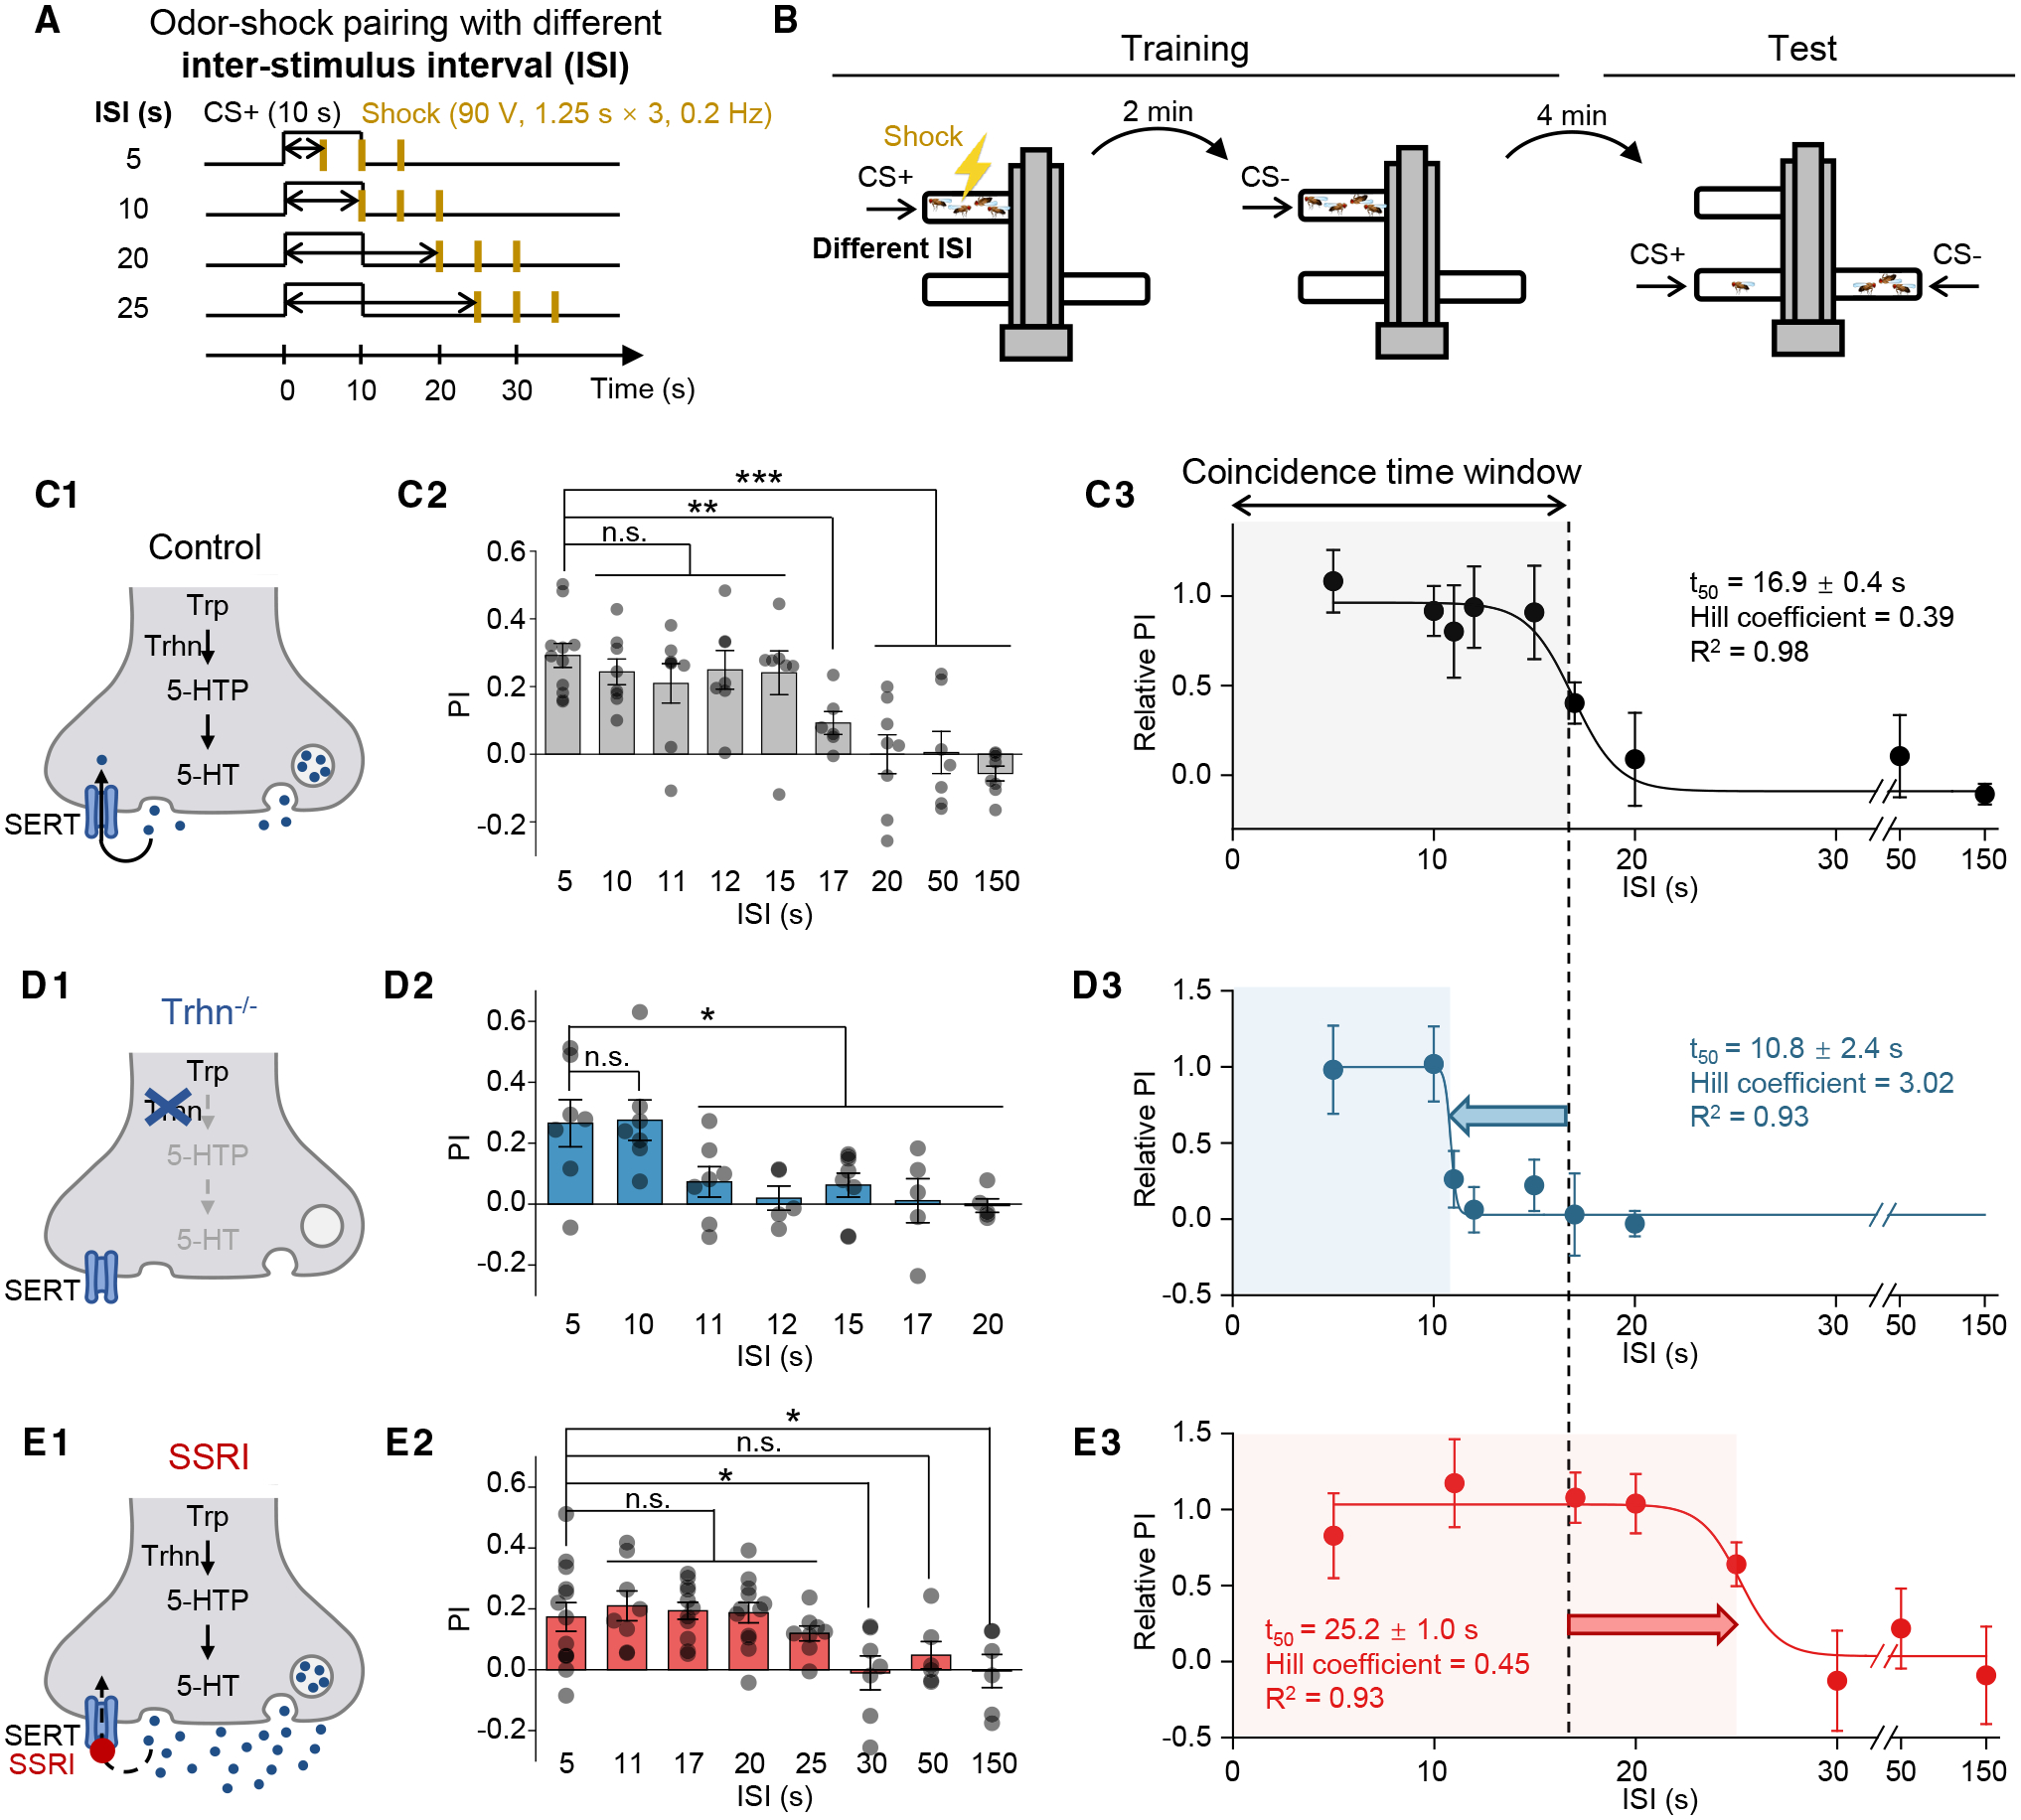
(A and B) Schematics depicting the protocol for odor-shock pairing with varying ISIs (A) and the T-maze assay for measuring the olfactory memory (B).
(C–E) (C1–E1) Schematics depicting the control flies, Trhn−/− flies, and the SSRI-fed flies (10 mM fluoxetine). (C2–E2) Summary of the PI measured with the indicated ISI; n = 5–11 for each group. (C3–E3) The relative PI-ISI profile fitted with a sigmoid function; the t50 ± standard error, Hill coefficient, and R2 are shown. The coincidence time window is defined as the t50 and indicated by the shaded area. The dashed vertical line at 16.9 s represents the coincidence time window of control flies.
In this and subsequent figures, all summary data are presented as the mean ± SEM, superimposed with individual data.
*p < 0.05; **p < 0.01; ***p < 0.001; and n.s., not significant (unpaired Student’s t test).