
Figure 6. Heterogeneous 5-HT signals gate the lengths of coincidence time windows for inducing synaptic depression in the γ1–γ3 compartments.
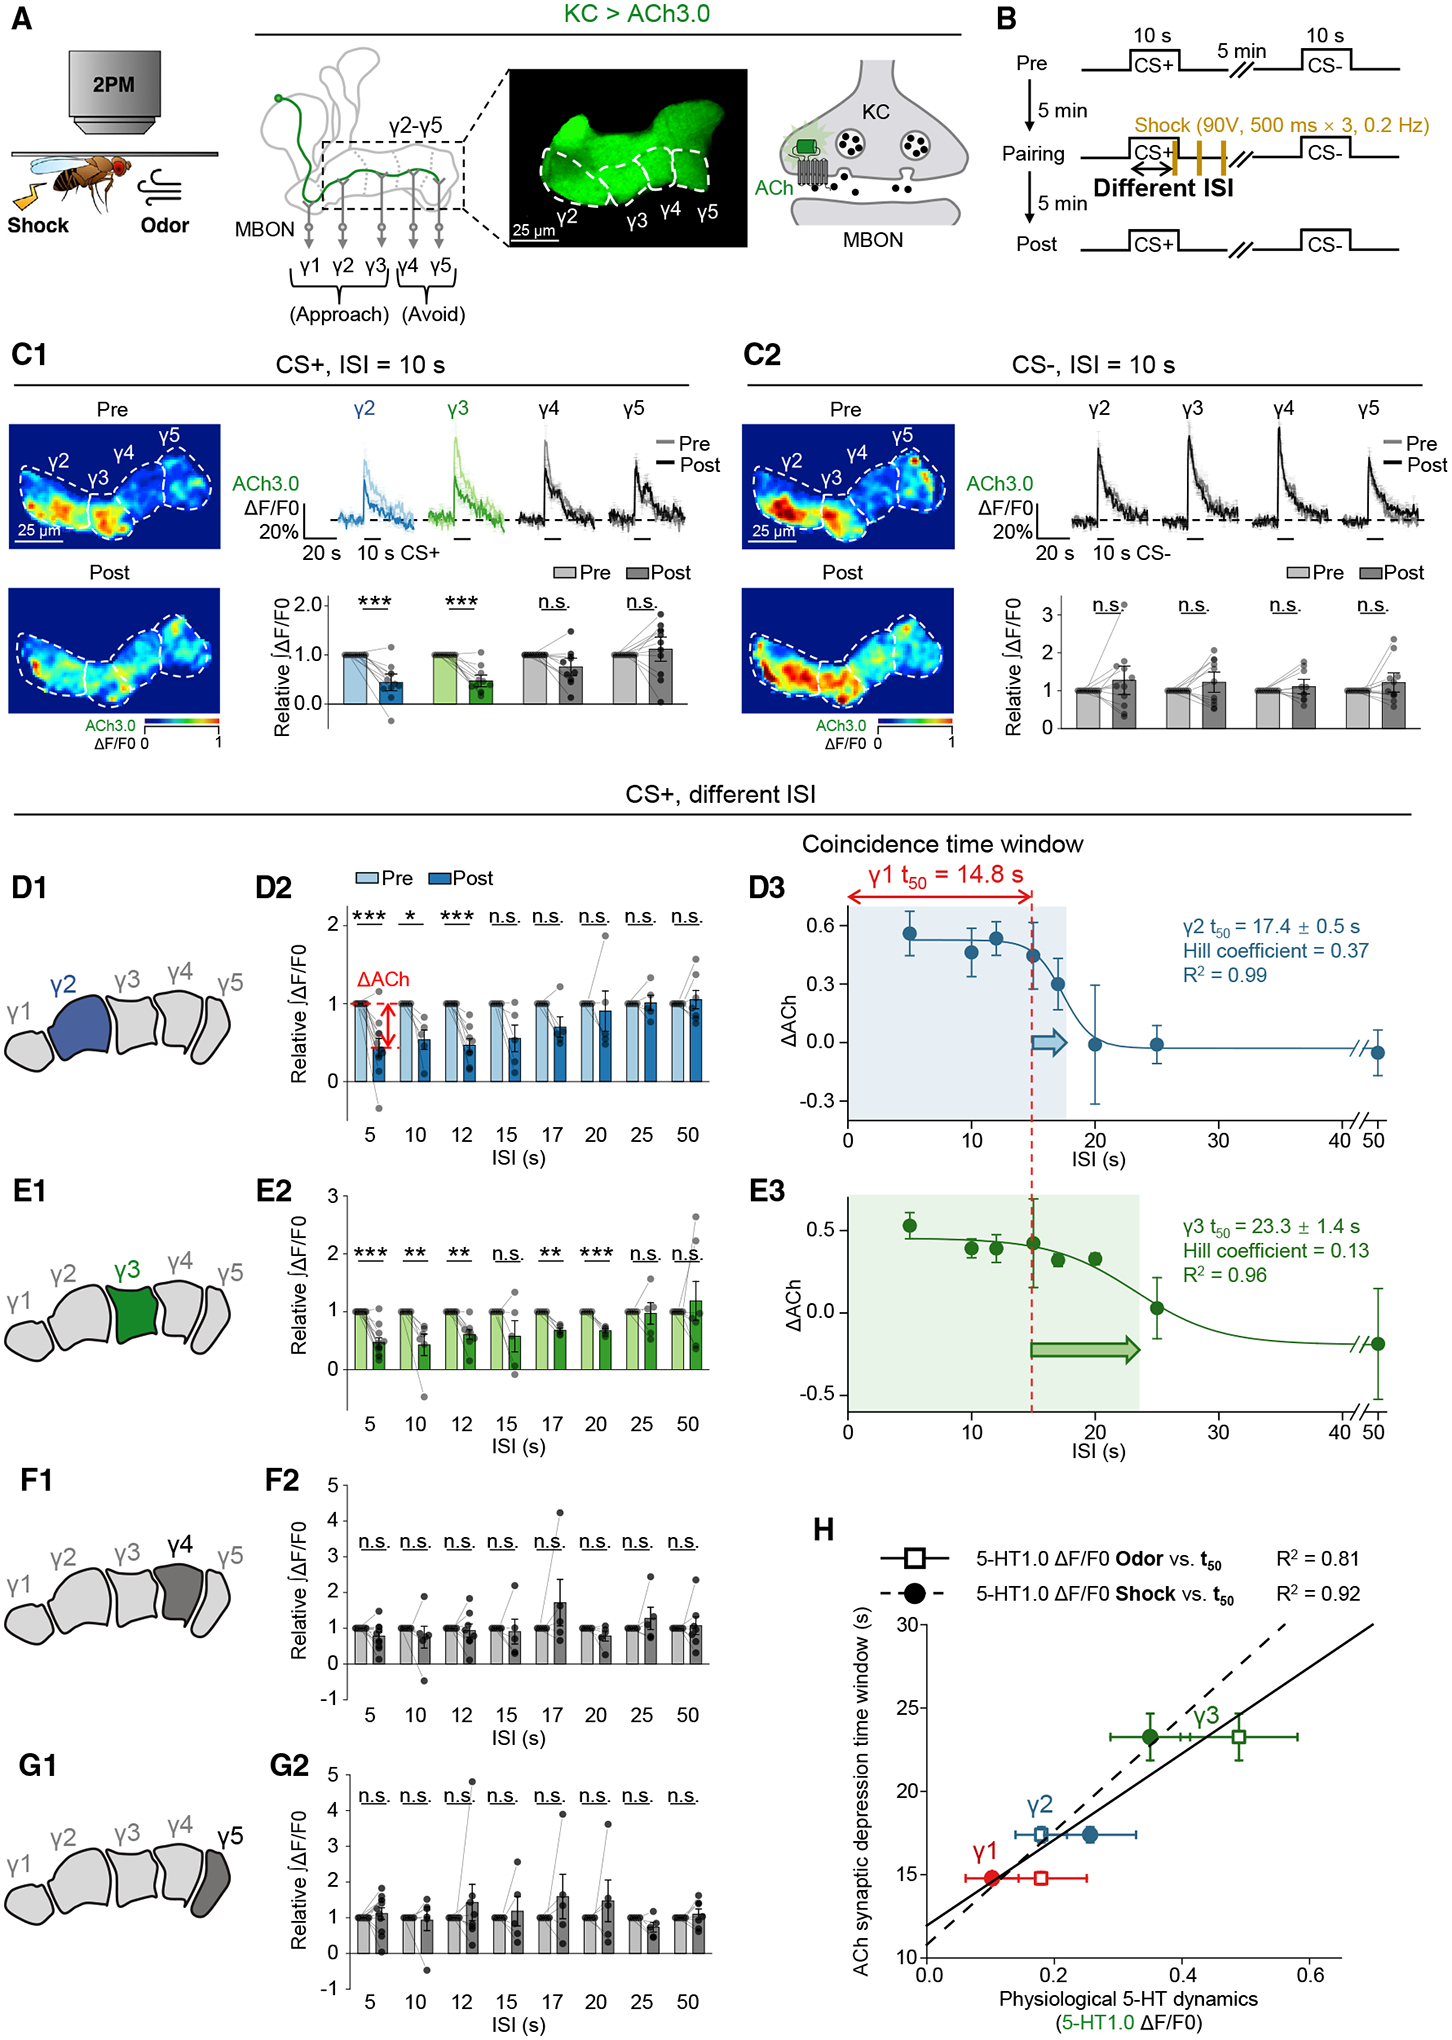
(A and B) Schematics depicting the in vivo imaging setup (A) and experimental protocol (B) for measuring changes in synaptic plasticity in the γ2–γ5 compartments, using ACh3.0 expressed in KCs.
(C) Flies were trained with odor-shock pairing with 10-s ISI, and changes in ACh3.0 fluorescence were compared between the pre- and post-pairing sessions, in response to the CS+ (C1) and CS− (C2). Shown are representative pseudocolor images (left), average (± SEM) traces (top right), and the summary (bottom right) of the ACh3.0 fluorescence; n = 11 flies/group.
(D–G) (D1–G1) Schematics depicting the measurement of synaptic depression in different γ lobe compartments, using ACh3.0 expressed in KCs. (D2–G2) Summary of the relative change of the integrated ACh3.0 fluorescence in response to the CS+ in pre- and post-pairing sessions with the indicated ISI. ΔACh indicates the difference between pre- and post-responses; n = 4–10 flies/group. (D3–E3) The ΔACh-ISI profile was fitted to a sigmoid function; the t50 ± standard error, Hill coefficient, and R2 are shown. The dashed vertical line at 14.8 s represents the coincidence time window measured for the γ1 compartment.
(H) Correlation analysis of coincidence time windows (y axis: t50 ± standard error) for inducing synaptic depression and the odor- or shock-evoked 5-HT dynamics (x axis: ΔF/F0 ± standard error) in γ1–γ3 compartments. Each set of data was fit to a linear function, and the R2 is shown.
*p < 0.05; **p < 0.01; ***p < 0.001; and n.s., not significant (paired Student’s t test).
See also Figure S2.