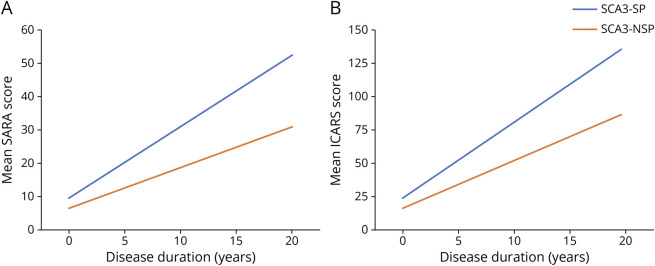
Figure 2. Longitudinal Trajectories of Mean Scale for the Assessment and Rating of Ataxia (SARA) and International Cooperative Ataxia Rating Scale (ICARS) Scores for SCA3 Patients With Spastic Paraplegia (SCA3-SP) and SCA3 Patients With Nonspastic Paraplegia (SCA3-NSP) Using a Linear Mixed-Effects Model.
(A–B) Longitudinal trajectories of mean SARA and ICARS scores showed lower progression for SCA3-SP than for SCA3-NSP. This observation included individuals sampled at different time points in the course of disease. Individuals were followed up for 0–5 visits. No individual was followed up for the full duration described on the x-axis. The graphs demonstrated the mean SARA and ICARS scores changes in the SCA3-SP and SCA3-NSP subgroups with covariates fixed at the following values: baseline age = 45 years, sex = male, baseline duration = 0 years, and the number of expanded CAG repeats = 75. Spaghetti plots demonstrating the change for individual participants are shown in eFigure 1.

