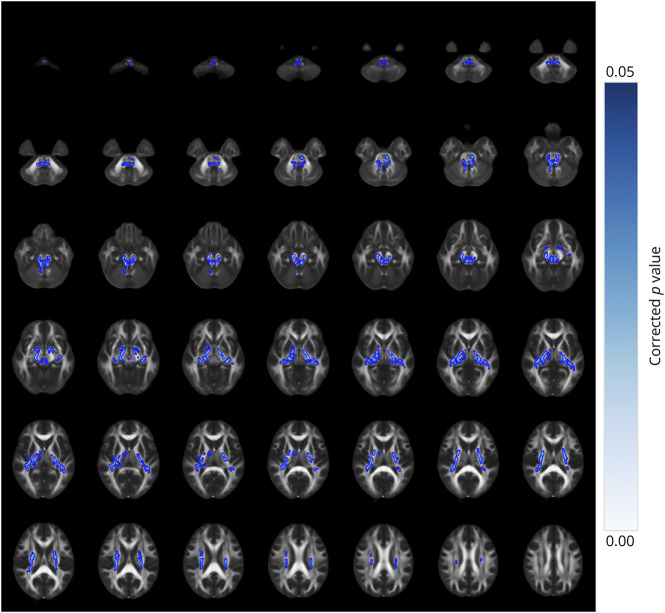
Figure 4. TBSS Analysis of Neurite Density Index (NDI) Metrics Across Different Subgroups.
Depicted are brain regions characterized by reduced NDI values of the SCA3 patients with spastic paraplegia (SCA3-SP) when compared with SCA3 patients with nonspastic paraplegia (SCA3-NSP). A post hoc test, p < 0.05, FWE-corrected.

