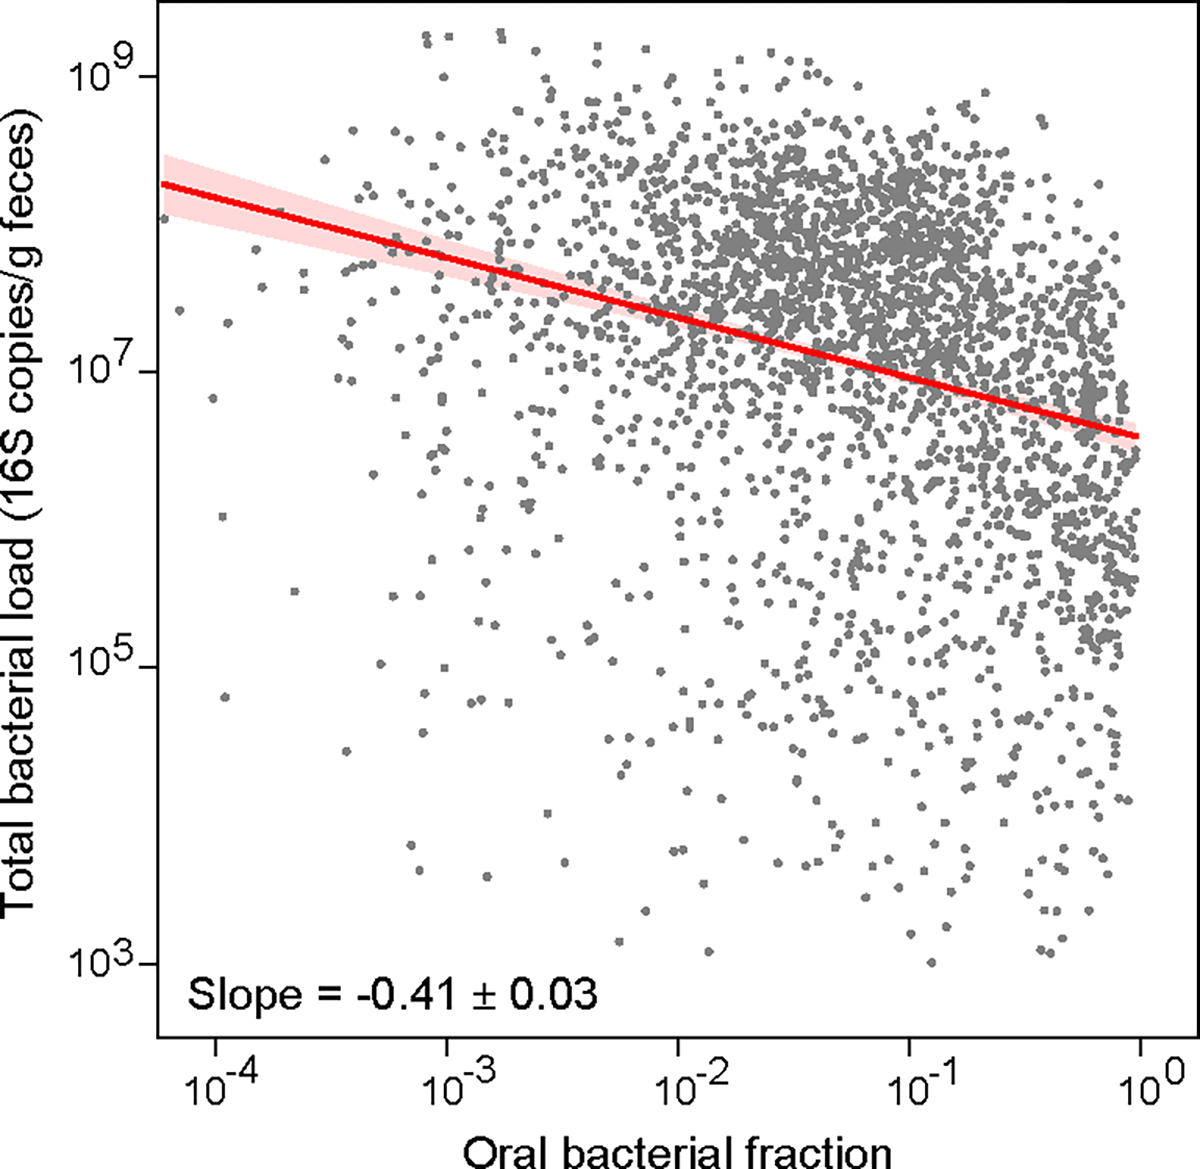
Extended Data Figure 6: Inverse correlation between oral bacterial fraction and total bacterial load in fecal samples from MSKCC allo-HCT recipients.

Each dot in the plot represents a fecal sample. Samples with zero oral bacterial fraction, or with total bacterial load less than 1,000 16S copies per gram of feces, or collected 20 days before or 40 days after transplantation were excluded from the plot and the linear regression analysis. The number of remaining samples is 2,524. The red line represents the best linear fit, and the shading of the same color indicates its ± 95% confidence interval. The plot also displays the estimated regression slope and its standard error.
