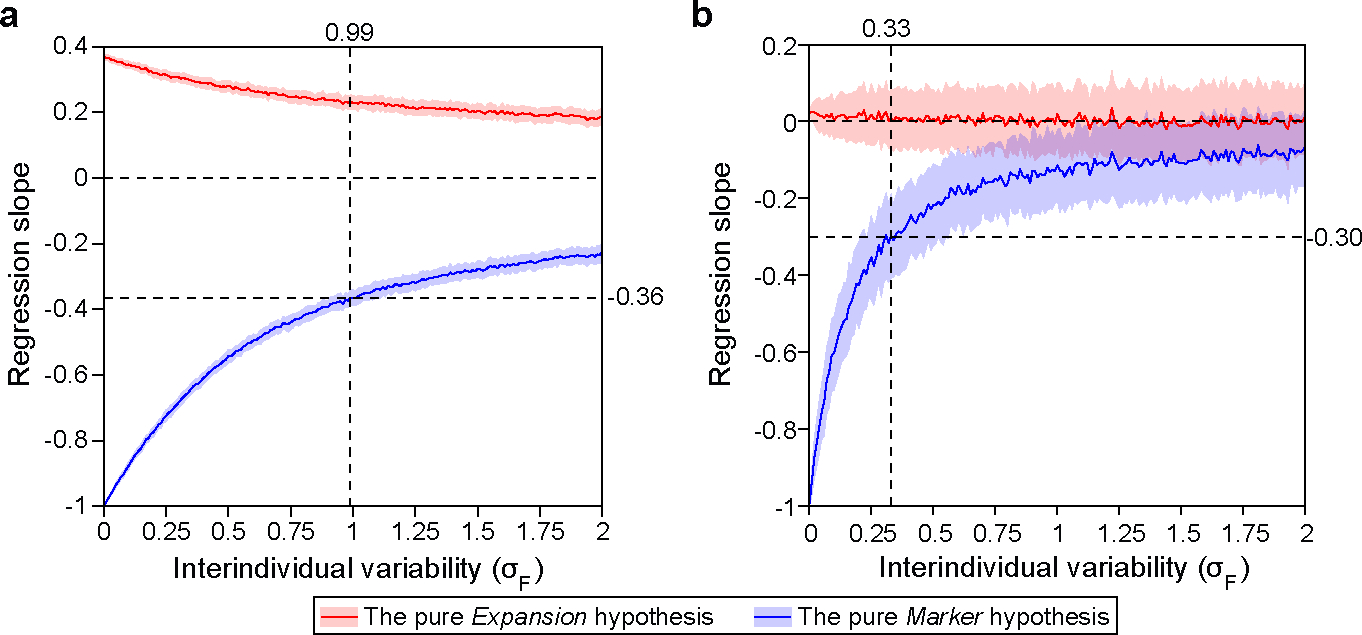
Extended Data Figure 7: Impact of interindividual variability on the regression slope between oral bacterial fraction and total bacterial load.

We generated synthetic datasets using parameters estimated from the MSKCC allo-HCT cohort analyzed in Fig. 4 (a) and the Crohn’s disease cohort analyzed in Fig. 5 (b). In both panels, we systematically varied (Eq. 1) from 0 to 2 while co-varying (Eq. 2) to maintain a constant ratio of . For each synthetic dataset, the regression slope was determined through linear regression between oral bacterial fraction and total bacterial load in the log-log space. The red and blue lines represent the mean slopes over 100 simulation runs, with the shaded regions of the same color indicating the standard deviations. Vertical dashed lines in the panel (a) and (b) mark the values estimated from the pre-antibiotic-prophylaxis samples in the allo-HCT cohort and from the healthy individuals in the Crohn’s disease cohort, respectively. At these values, the pure Marker hypothesis predicted that the regression slopes are −0.36 and −0.30. For detailed information on our simulation approach, please refer to the Methods section.
