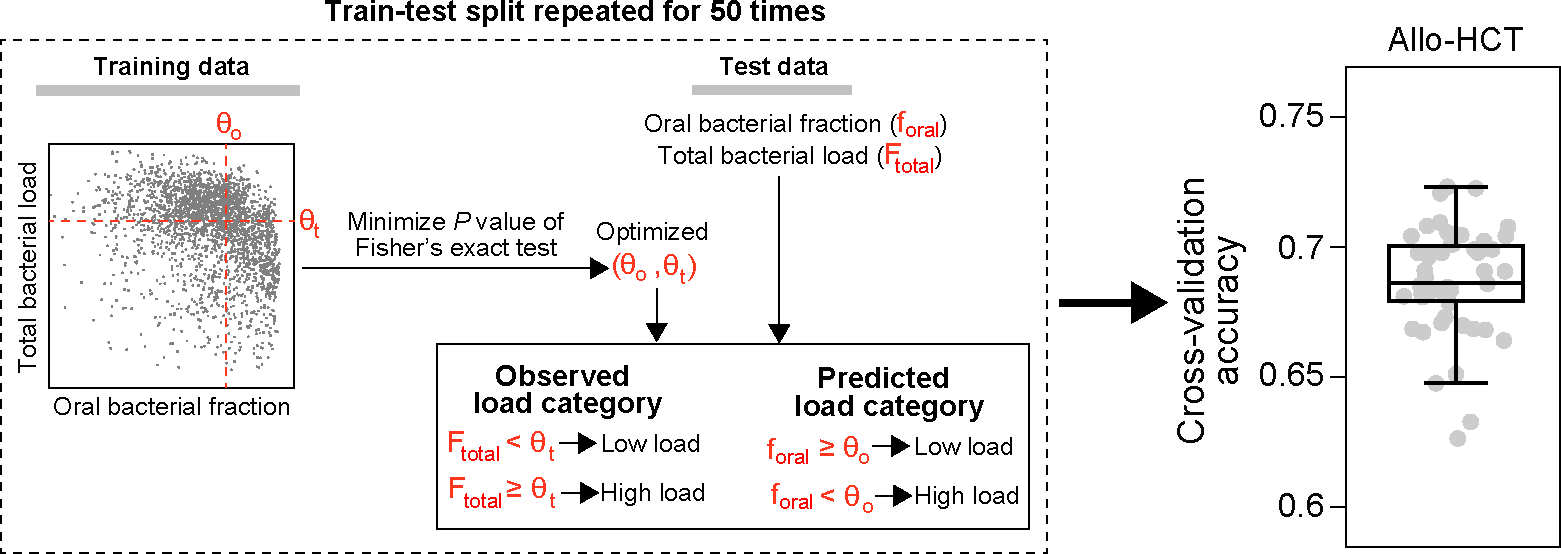
Extended Data Figure 8: Cross-validation accuracy for classifying total bacterial load in fecal samples from MSKCC allo-HCT recipients.

A schematic illustration of our classification model is enclosed in the dashed box. Our model uses two threshold parameters, and , to convert the oral bacterial fraction and total bacterial load into binary categories, respectively. Given training data, we optimized the two cutoff parameters by minimizing the P value of Fisher’s exact test of independence, subject to the constraints and . The optimized . was subsequently applied to predict high or low bacterial loads in the test set by comparing the oral bacterial fractions to . Simultaneously, we binarized the observed bacterial loads by comparing them to . Accuracy was assessed by comparing the predicted bacterial load categories to the observed bacterial load categories. In the boxplot, each dot corresponds to a single 5-fold cross-validation split and the random train-test split was repeated 50 times. Box plots represent the median, 25th and 75th percentiles and whiskers represent the 95th and 5th percentiles.
