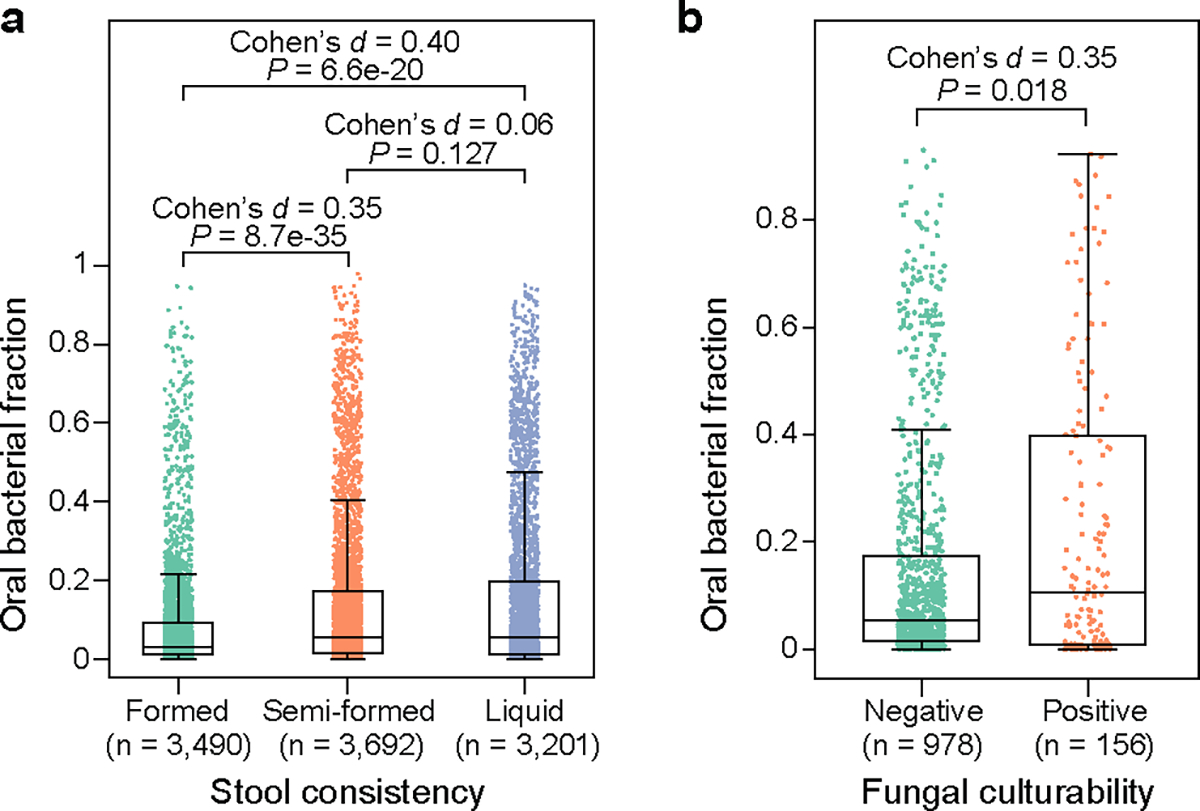
Extended Data Figure 9: Distribution of oral bacterial fraction in fecal samples from MSKCC allo-HCT recipients, categorized by stool consistency.

(a) and fungal cultivability (b). Each dot represents a fecal sample. FDR-corrected P values were calculated using a two-sided Mann-Whitney U test. Box plots represent the median, 25th and 75th percentiles and whiskers represent the 95th and 5th percentiles.
