
Extended Data Figure 10: Emergence of new oral ASVs in mouse feces after antibiotic treatment.
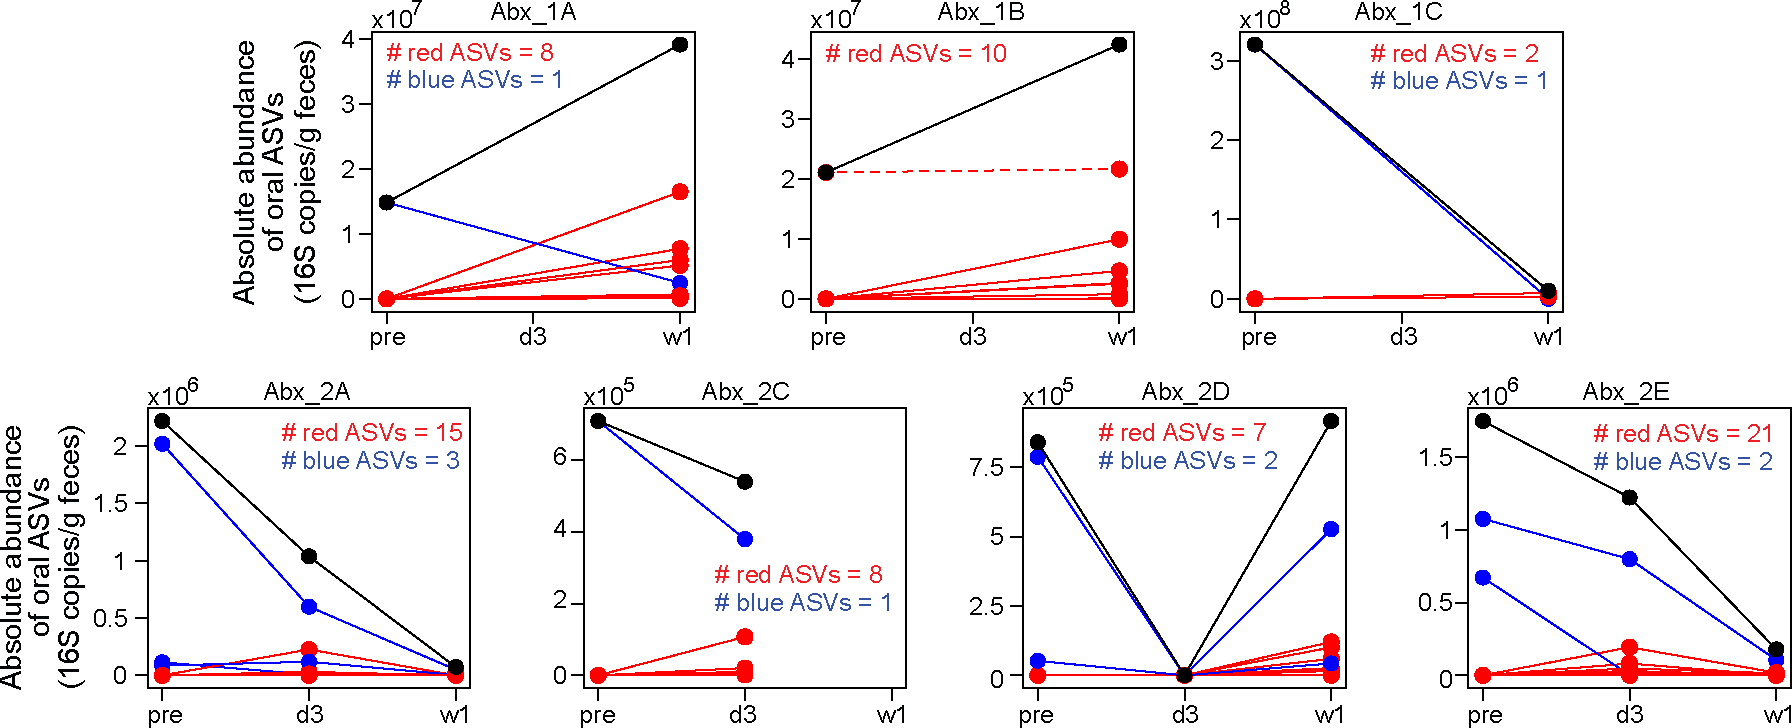
Each panel plots data from one mouse. Mouse Abx_2B was excluded due to the absence of its pre-treatment fecal sample. In each panel, individual oral ASVs are shown by lines. ASVs that increased in absolute abundance after treatment (i.e., post-treatment average > pre-treatment) are shown in red, while those that decreased or remained unchanged (post treatment average ≤ pre-treatment) are shown in blue. The black line in each panel represents the total absolute abundance, which is the sum of all red and blue lines. Except for one oral ASV in mouse Abx_1B (shown as a red dashed line), all ASVs displaying increased absolute abundance (solid red lines) were not present in the pre-treatment fecal samples; they represent new ASVs emerging from the oral cavity. Samples were collected at three time points: pre (before treatment), d3 (3 days after treatment initiation), and w1 (one week after treatment initiation).