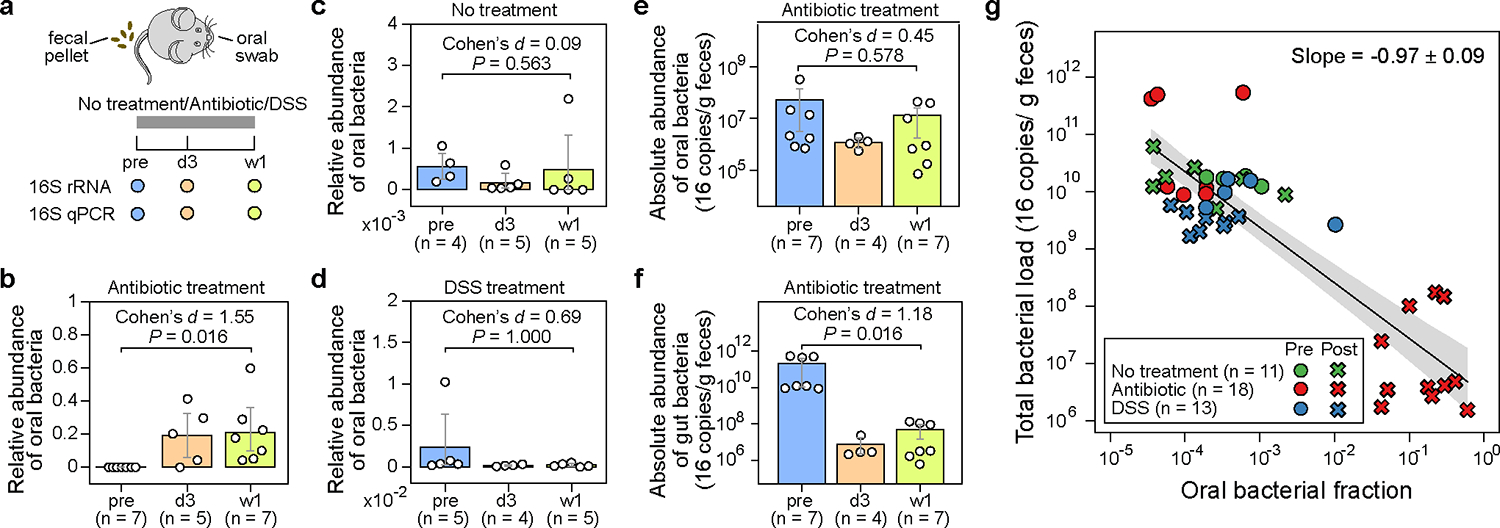
Figure 2: The administration of antibiotics to mice depletes gut bacteria and increases the relative abundance of oral bacteria in fecal samples.

a, Experimental design. The experiment included three research arms: untreated controls (n=5), mice administered an antibiotic cocktail of ampicillin, vancomycin, and neomycin (n=8), and mice treated with dextran sulfate sodium (DSS) (n=5). Paired fecal and oral samples were collected at three-time points: the same day before treatment initiation (pre), 3 days after treatment initiation (d3), and one week after treatment initiation (w1). Samples with less than 1,000 reads were excluded from analysis and not shown in panels (b)-(g). b-d, Relative abundance of oral bacteria in fecal samples from mice in the antibiotic treatment group (b), no treatment group (c), and DSS treatment group (d). e,f, Absolute abundance of oral (e) and gut (f) bacteria in fecal samples from antibiotic-treated mice. In panels (b)-(f), each circle represents a fecal sample. Bar heights represent the means, with error bars indicating the 95% confidence interval (CI). P values were calculated using a one-sided Wilcoxon signed-rank test. g, Linear regression between oral bacterial fraction and total bacterial load in the log10-log10 scale. Pre-treatment (pre) and post-treatment (d3, w1) samples are represented by circles and crosses, respectively. The black line, and the shading of the same color indicates the ±95% CI. Samples with zero oral bacterial fraction were not shown and excluded from the linear regression analysis.
