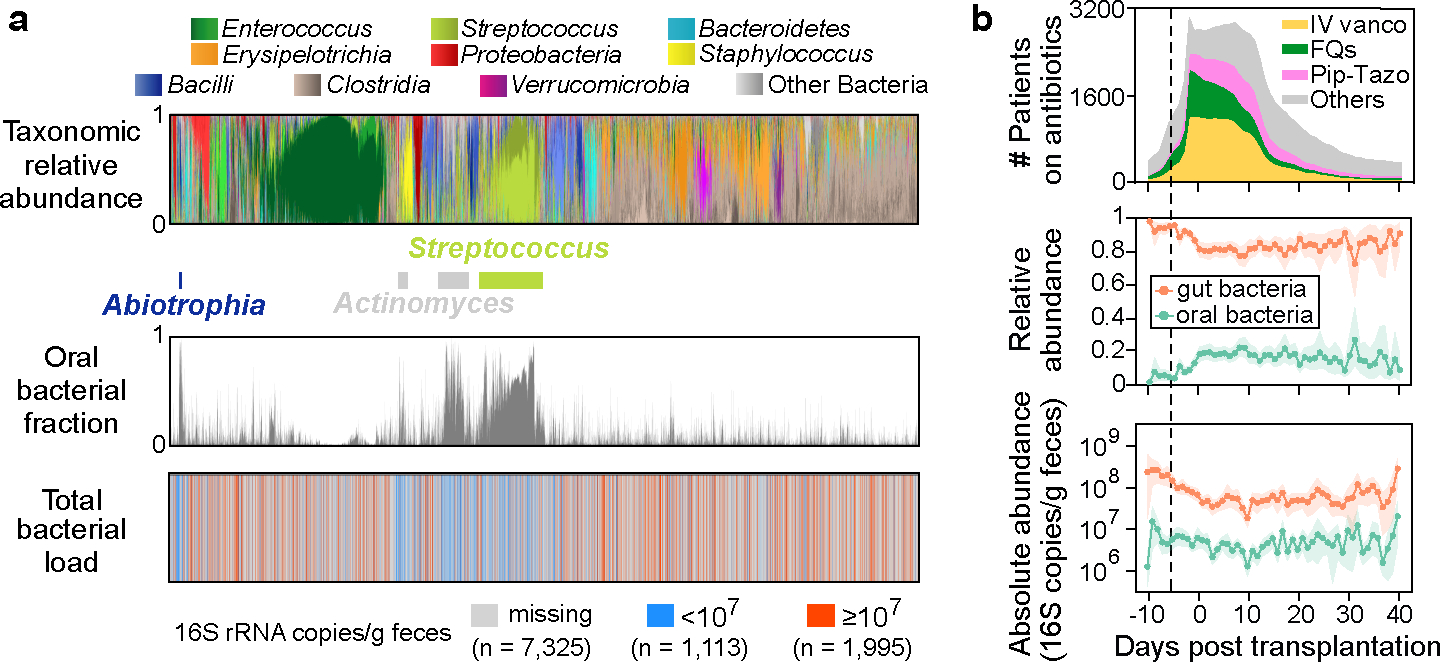
Figure 4: Relative enrichment of oral bacteria in fecal samples of allo-HCT patients coincides with onset of antibiotic prophylaxis and depletion of gut bacteria.

a, Bacterial population composition in all 10,433 fecal samples from our MSKCC dataset. Each thin vertical bar represents a single sample, with taxonomic composition (top), estimated oral bacterial fraction (middle), and total bacterial load (bottom) aligned for all samples. b, Profiles of antibiotic exposure (top) aligned with the population dynamics of relative (middle) and absolute (bottom) abundance of oral (green curves) and gut (orange curves) bacteria in feces. Lines and dots represent the means, and shadings of the same color indicate the 95% confidence interval. The black dashed line marks the median day −6 when antibiotic prophylaxis was initiated. IV vanco: intravenous vancomycin; FQs: fluoroquinolones; Pip-Tazo: piperacillin-tazobactam.
