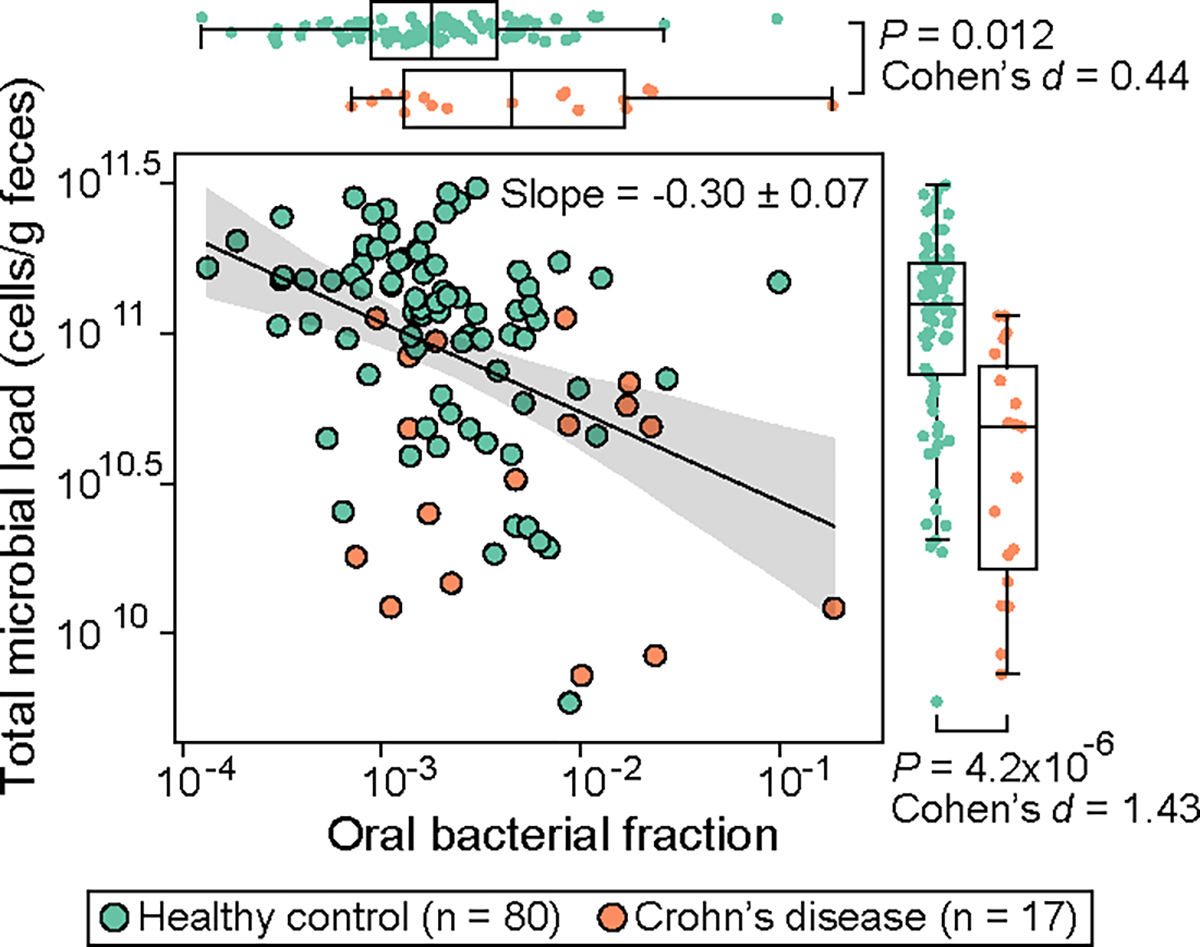
Figure 5: Inverse correlation between total fraction of oral bacteria and microbial load in fecal samples of patients with Crohn’s disease.

Each circle represents a fecal sample. Samples with zero oral bacterial fraction in the original dataset were excluded from the plot and statistical analyses. The black line represents the best linear fit, and the shading of the same color indicates the 95% confidence interval. The plot also displays the regression slope and its standard error. P values for the difference in the marginal distributions between patient and control groups were calculated using a one-sided Mann-Whitney U test. Box plots represent the median, 25th and 75th percentiles and whiskers represent the 95th and 5th percentiles.
