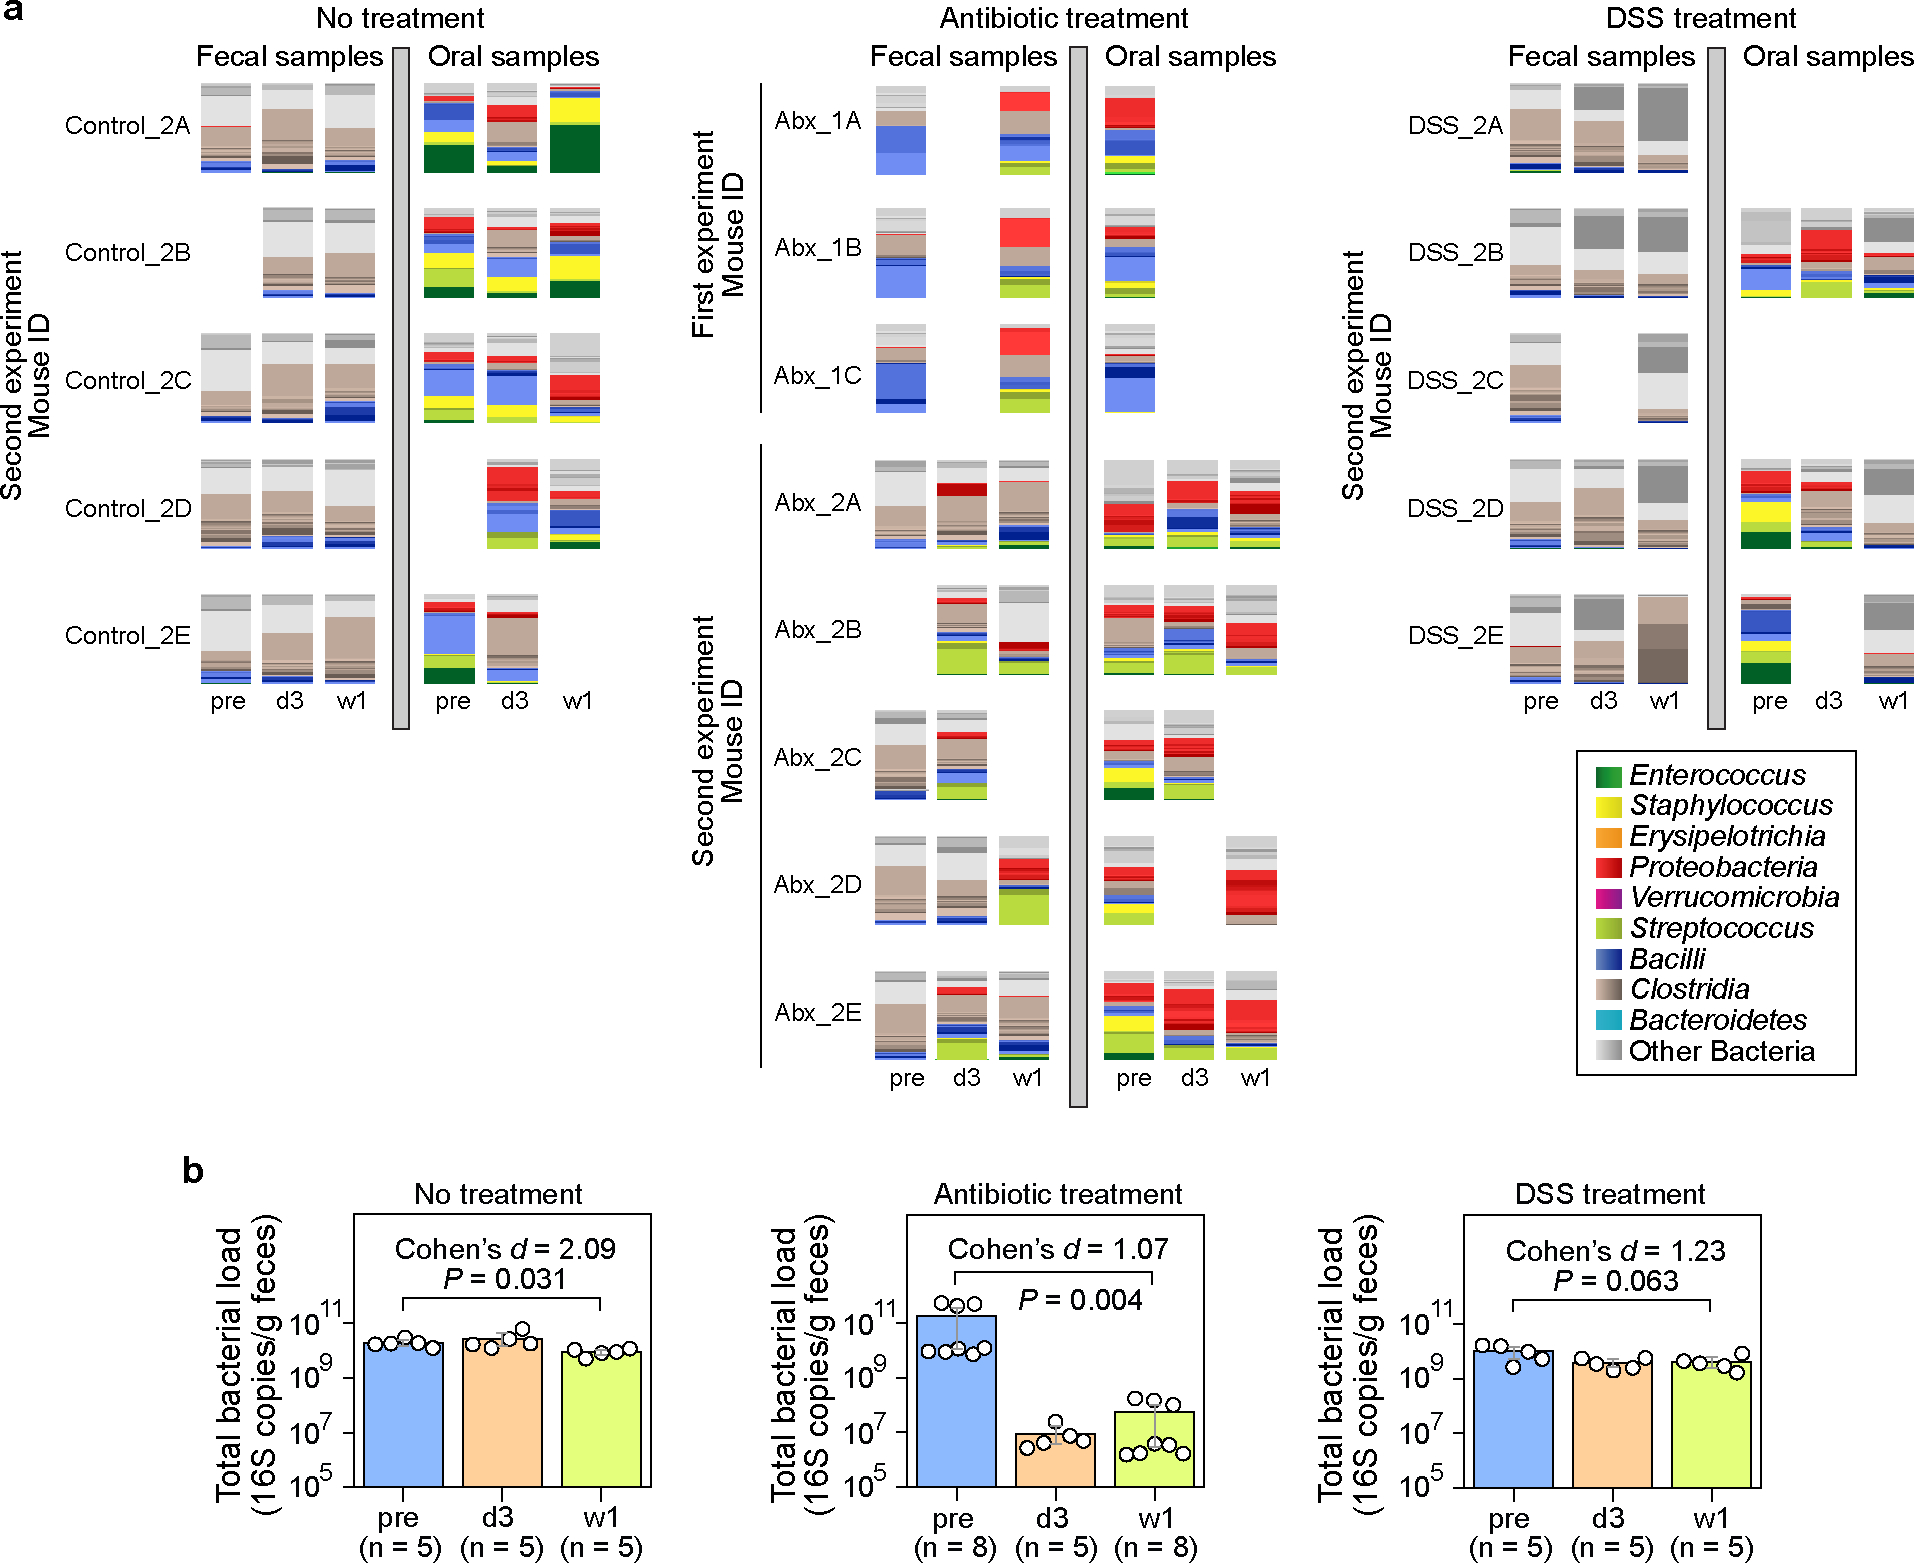
Extended Data Figure 1: Paired fecal and oral microbiome samples in the mouse experiments.

a, Bacterial ASV profiles displayed using stacked bar plots. Samples were collected at three time points: pre (before treatment), d3 (3 days after treatment initiation), and w1 (one week after treatment initiation). Missing samples in the second experiment were due to low sequence coverage (samples with less than 1,000 reads were excluded). b, Total bacterial load in fecal samples (circles). Bar heights represent the means, with error bars indicating the 95% confidence interval. P values were calculated using a one-sided Wilcoxon signed-rank test. DSS: Dextran Sulfate Sodium.
