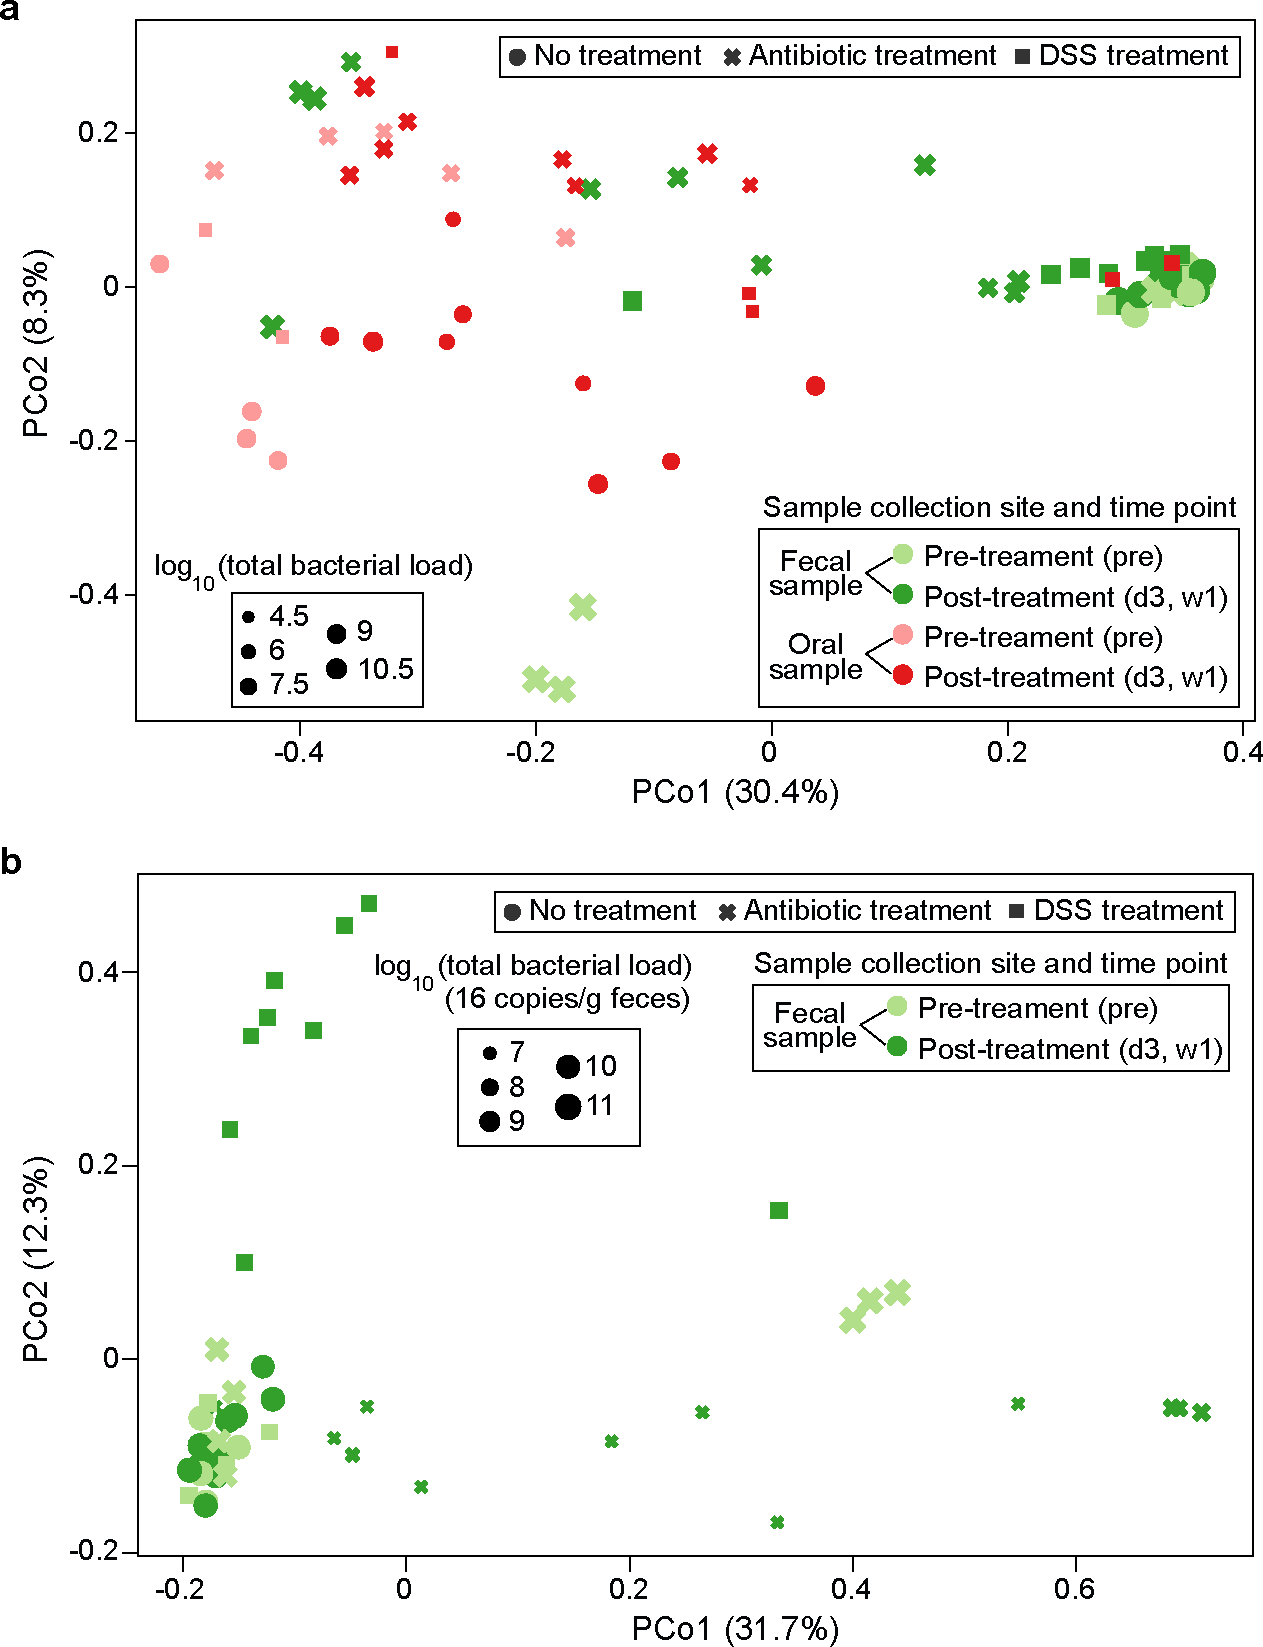
Extended Data Figure 3: Principal coordinate analysis plot of the microbiome samples in the mouse experiments.

PCo1 and PCo2 represent principal component 1 and 2, respectively. a, Fecal and oral samples together. The unit of total bacterial load is 16S copies per gram of feces for fecal samples and 16S copies per swab for oral samples. b, Fecal samples only. Panel b shows that PCo1 captures the gut microbiota changes after antibiotic treatment, while PCo2 captures the gut microbiota changes after DSS treatment. DSS: Dextran Sulfate Sodium.
