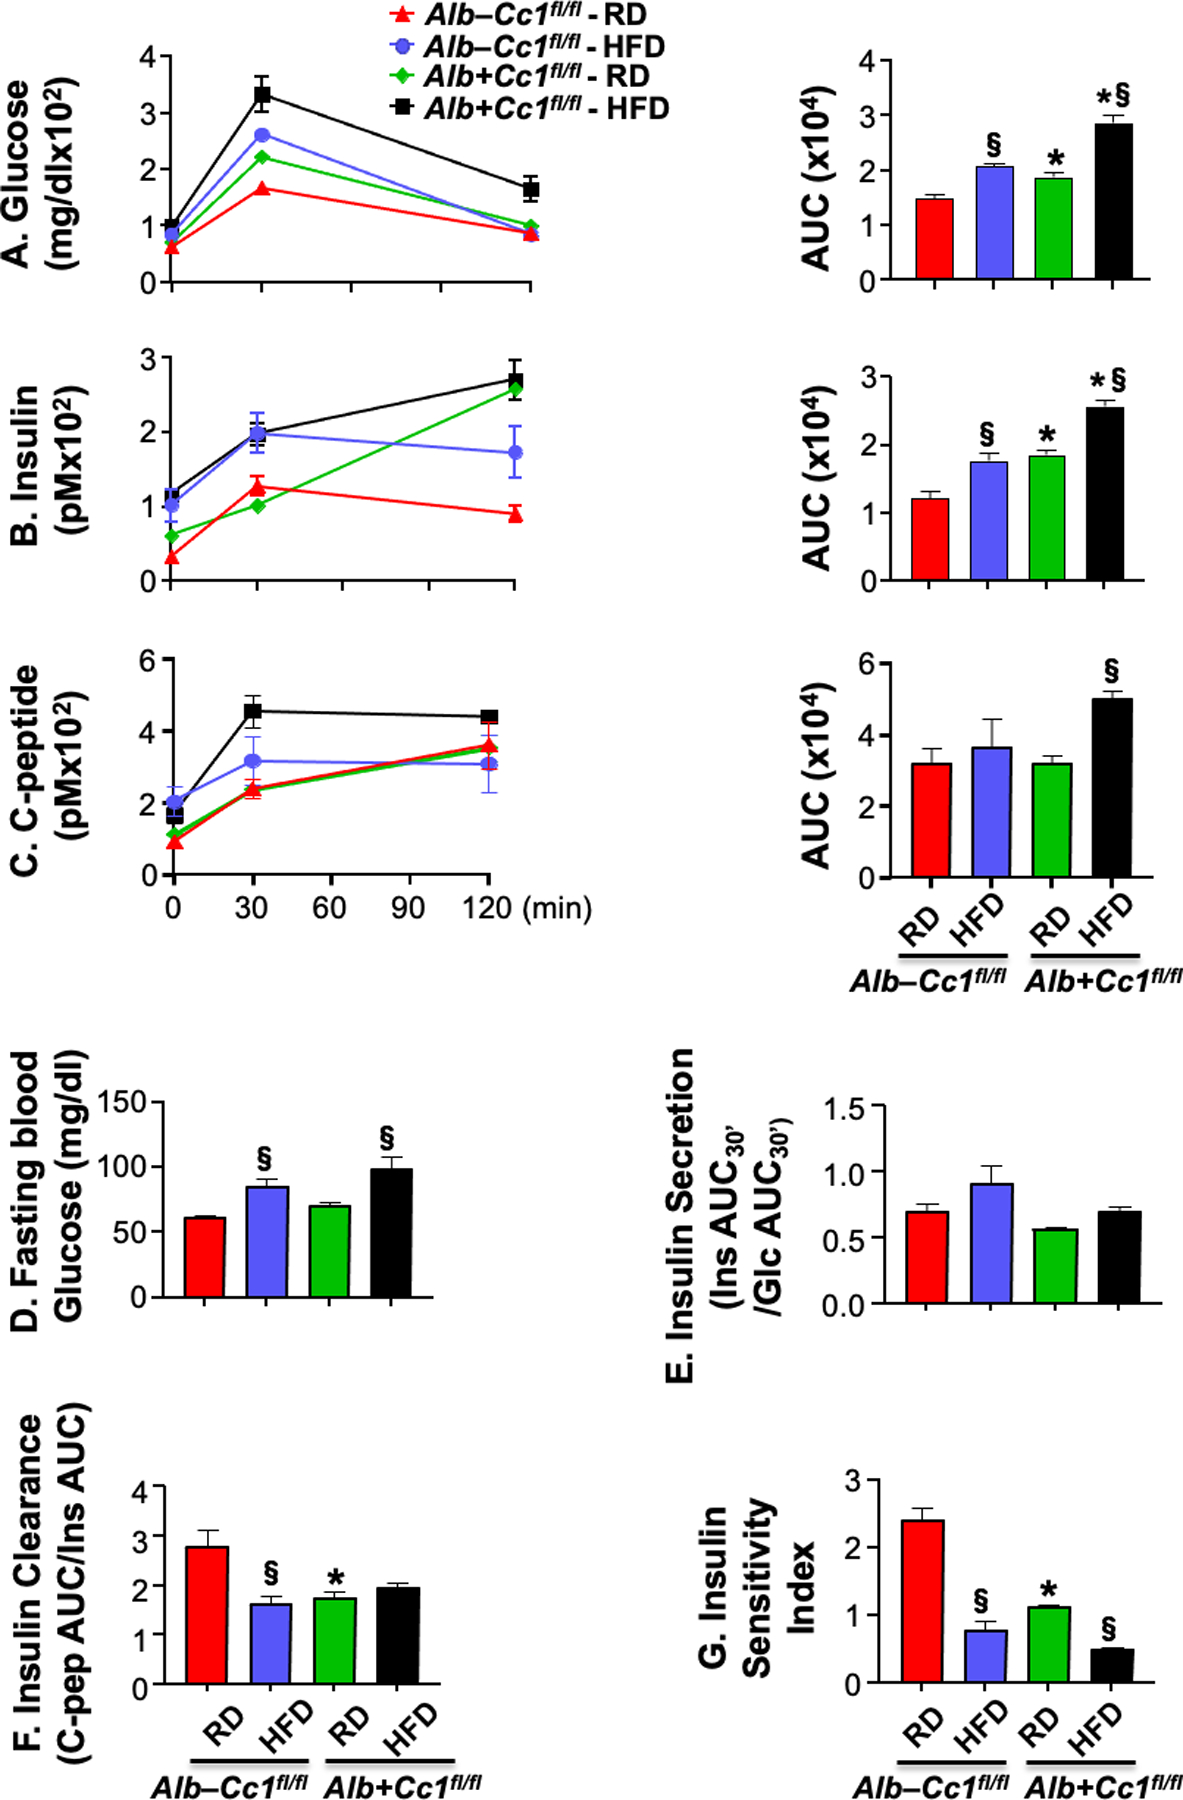
FIGURE 1.

Insulin metabolism during IPGTT. (A-C) glucose, insulin and C-peptide levels were measured at 0, 30 and 120 min post i.p. injection of glucose in age-matched 8-month-old mice fed with a regular diet [RD, red (control) and green (mutant) bars] or a high-fat diet [HFD, blue (control) and black (mutant) bars] in the last 3 months before sacrifice (n=3–4/genotype/feeding group). Accompanying graphs represent area under the curve (AUC). (D) fasting blood glucose, (E) insulin secretion (Ratio of Insulin AUC at 0–30 min/Glucose AUC at 0–30 min), (F) insulin clearance (C-peptide AUC/Insulin AUC) and (G) Insulin Sensitivity Index were also measured. Values were expressed as means ± SEM. *P<0.05 Alb+Cc1fl/fl vs Alb–Cc1fl/fl per feeding group; §P<0.05 HFD vs RD per genotype.
