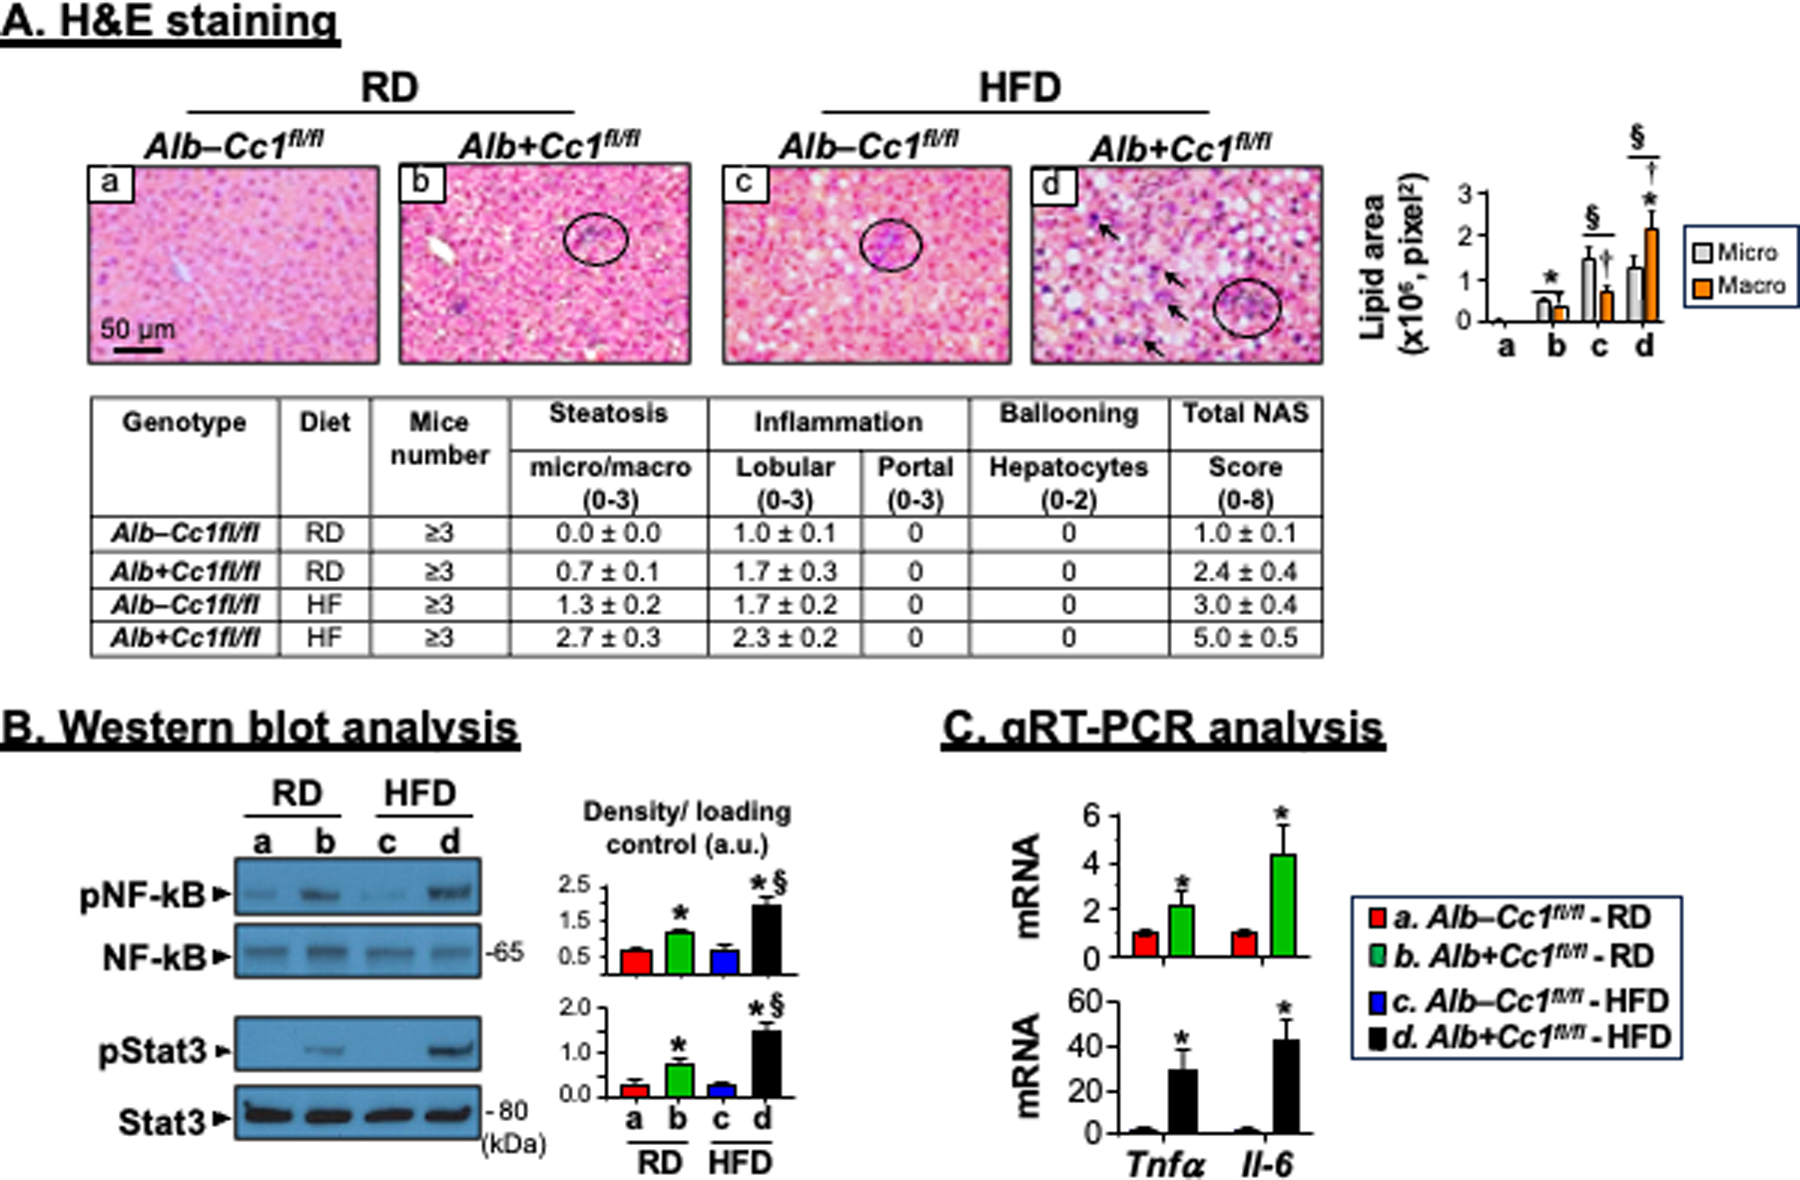
FIGURE 2.

Histological and biochemical analysis of inflammation. Livers were removed from 8-month-old mice following feeding either a regular chow (RD) diet or a HFD diet for 3 months. (A) H&E staining of liver sections to identify foci of inflammatory cell infiltrates. Accompanying table represents NAS (n=3–6 mice/genotype/feeding group). Scoring was performed independently by 2–3 different scientists based on NIH guidelines. In the accompanying graph, the areas of lipid vesicles were assessed using Image J (v1.53t) in 5 fields/mouse at 20X magnification and means ± SEM in pixel2 unit were presented. *P<0.05 Alb+Cc1fl/fl vs Alb–Cc1fl/fl per feeding group; §P<0.05 HFD vs RD per genotype; †P<0.05 macrovesicles vs microvesicles per genotype. (B) Western blot analysis was performed on liver lysates from randomly picked 2 mice/genotype/feeding group. Representative gels indicate the activation (phosphorylation) of NF-κB and Stat3 inflammatory pathways using phospho-antibodies normalized against total NF-κB and Stat3 loaded proteins, respectively. Numbers to the right of the gels indicate apparent molecular mass (kDa). Gels were scanned and the density of the test band was divided by that of its corresponding loading control and represented in arbitrary units (a.u) in the accompanying graph. Values were expressed as means ± SEM. *P<0.05 Alb+Cc1fl/fl vs Alb–Cc1fl/fl per feeding group; §P<0.05 HFD vs RD per genotype. (C) qRT-PCR analysis of Tnfα and Il-6 mRNA in liver lysates normalized to 18s. Values were expressed as means ± SEM. *P<0.05 vs Alb–Cc1fl/fl.
