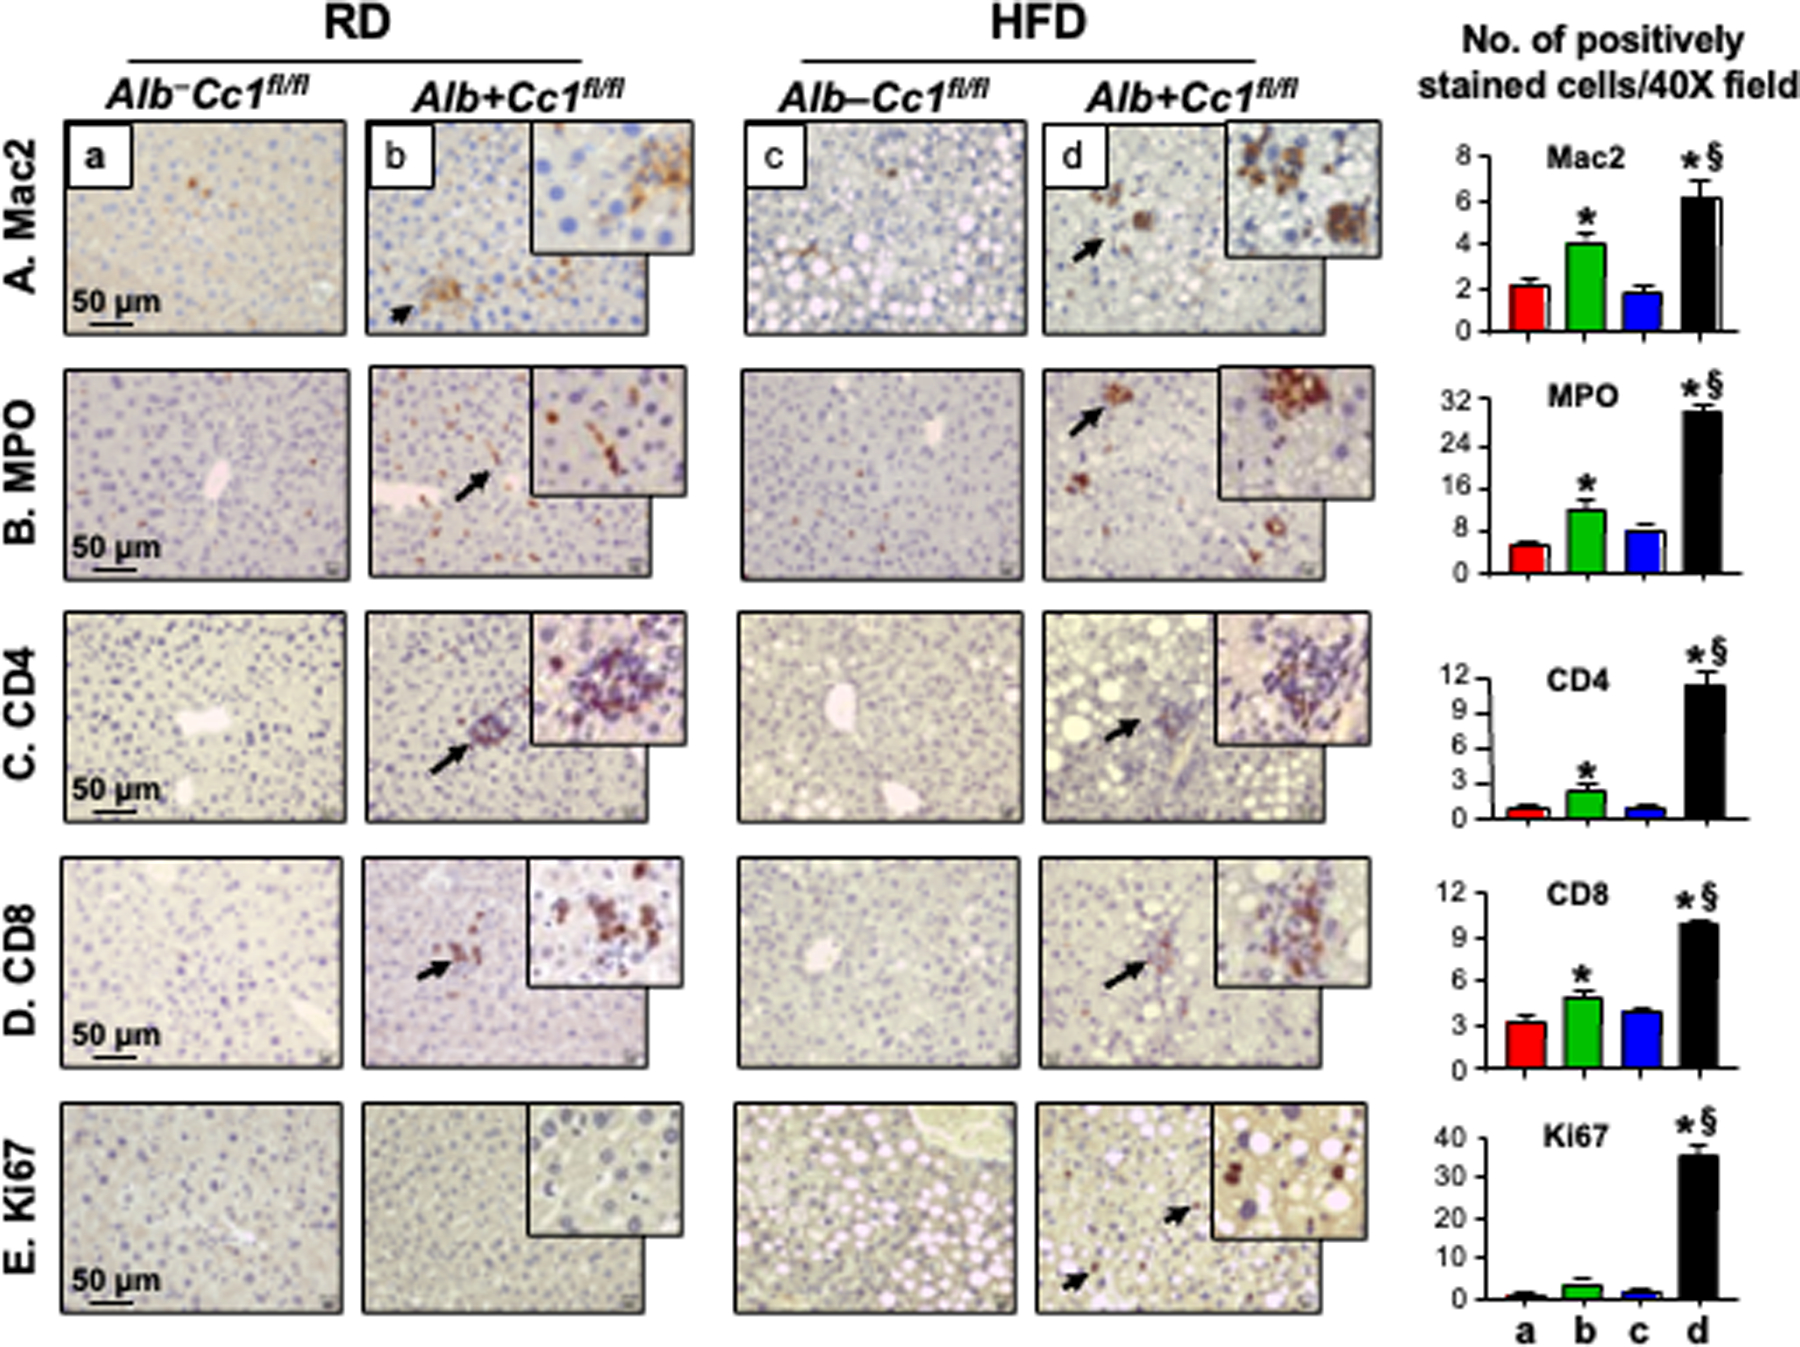
FIGURE 3.

Immunohistochemical analysis of inflammation and cell proliferation. Livers were removed from 8-month-old Alb+Cc1fl/fl mice (panels b and d), and their littermate controls (panels a and c) (n = 6/genotype/feeding group) and their sections subjected to IHC analysis to detect inflammatory cells (A-D) using (A) Mac2 for macrophage activation, (B) MPO to determine neutrophil accumulation and (C-D) CD4 and CD8 to immunostain T cells. (E) sections were immunostained with Ki67 to examine cell proliferation. Representative images were taken at 50μm magnification and shown with insets at 20μm. Number of positively stained cells were counted in 5 fields/mouse at 40X magnification and means ± SEM were presented graphically. *P<0.05 Alb+Cc1fl/fl vs Alb–Cc1fl/fl per feeding group; §P<0.05 HFD vs RD per genotype.
