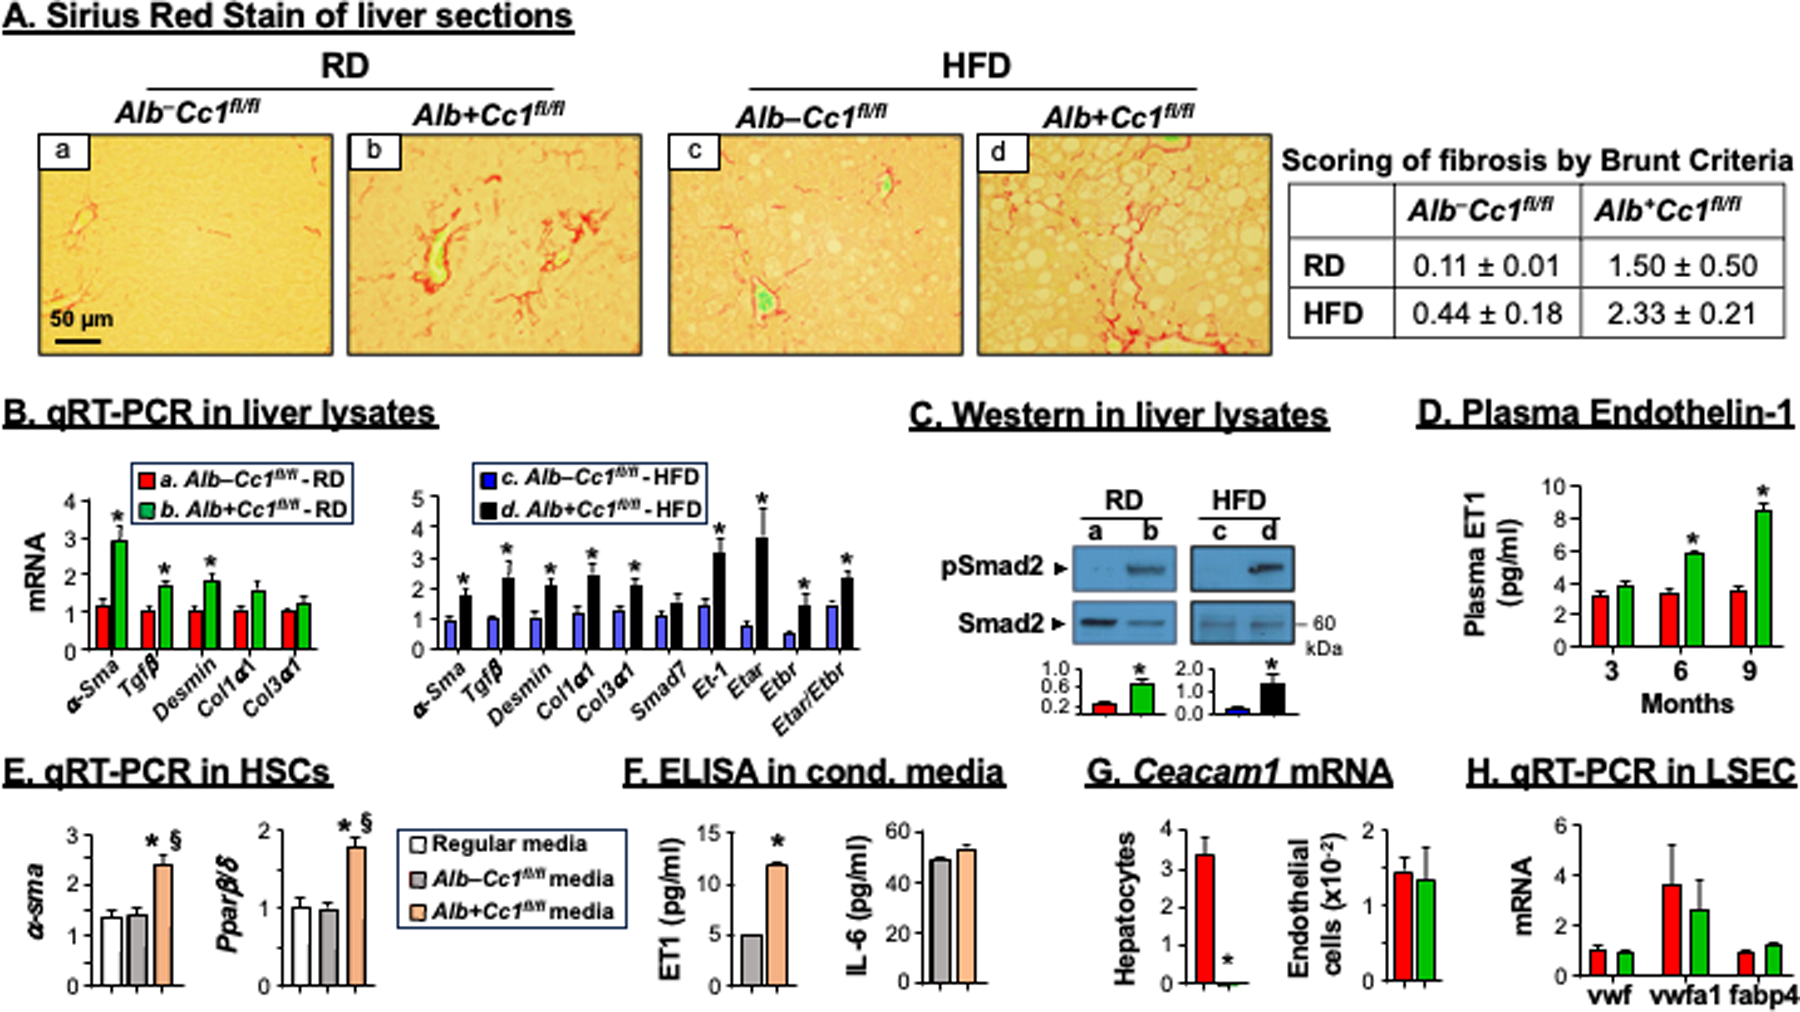
FIGURE 4.

Analysis of fibrosis. Livers were removed from 8-month-old mice (n=6/genotype/feeding group). (A) Sirius Red staining was performed to detect interstitial (panel b) and bridging (panel d) deposition of collagen fibers in mutant mice. Representative images were taken at 50μm magnification. Accompanying table shows fibrosis scoring per Brunt criteria. (B) mRNA analysis of fibrotic markers in liver tissues normalized to 18s from RD-fed controls (red bars) and mutants (green bars) and from HFD-fed controls (blue bars) and mutants (black bars). Values were expressed as means ± SEM. *P<0.05 vs Alb–Cc1fl/fl. (C) Western blot analysis was performed on liver lysates as in the legend to Figure 2. Representative gels indicate the activation (phosphorylation) of α-phosphoSmad2 antibody normalized against total loaded Smad2 proteins. Number to the right of the gels indicate apparent molecular mass (kDa). Gels were scanned and the density of the test band was divided by that of its corresponding loading control and represented in arbitrary units (a.u) in the accompanying graph. (D) plasma ET1 levels in RD-fed Alb–Cc1fl/fl (red bars) and Alb+Cc1fl/fl mice (green bars) at 3, 6 and 9 months of age. Values were expressed as mean ± SEM. *P<0.05 vs AlbCre–Cc1fl/fl controls. (E) Primary hepatic stellate cells (HSCs) from control mice were re-incubated with their collected regular media (white bar), media transferred from AlbCre–Cc1fl/fl control hepatocytes (grey bars) or media from AlbCre+Cc1fl/fl mutant hepatocytes (orange bar). HSCs activation was determined by qRT-PCR analysis of α-Sma and Pparβ/δ relative to 18s in duplicate. (F) ET1 and IL-6 content was assessed in conditioned media. Values were expressed as mean ± SEM. *P<0.05 vs AlbCre–Cc1fl/fl control media and §P<0.05 vs regular media. (G) qRT-PCR analysis of Ceacam1 mRNA levels in hepatocytes and endothelial cells normalized to 18s. Values were expressed as mean ± SEM. *P<0.05 vs AlbCre–Cc1fl/fl. (H) qRT-PCR analysis of mRNA levels of genes marking cell damage in LSECs performed in duplicate. Values were expressed as mean ± SEM.
