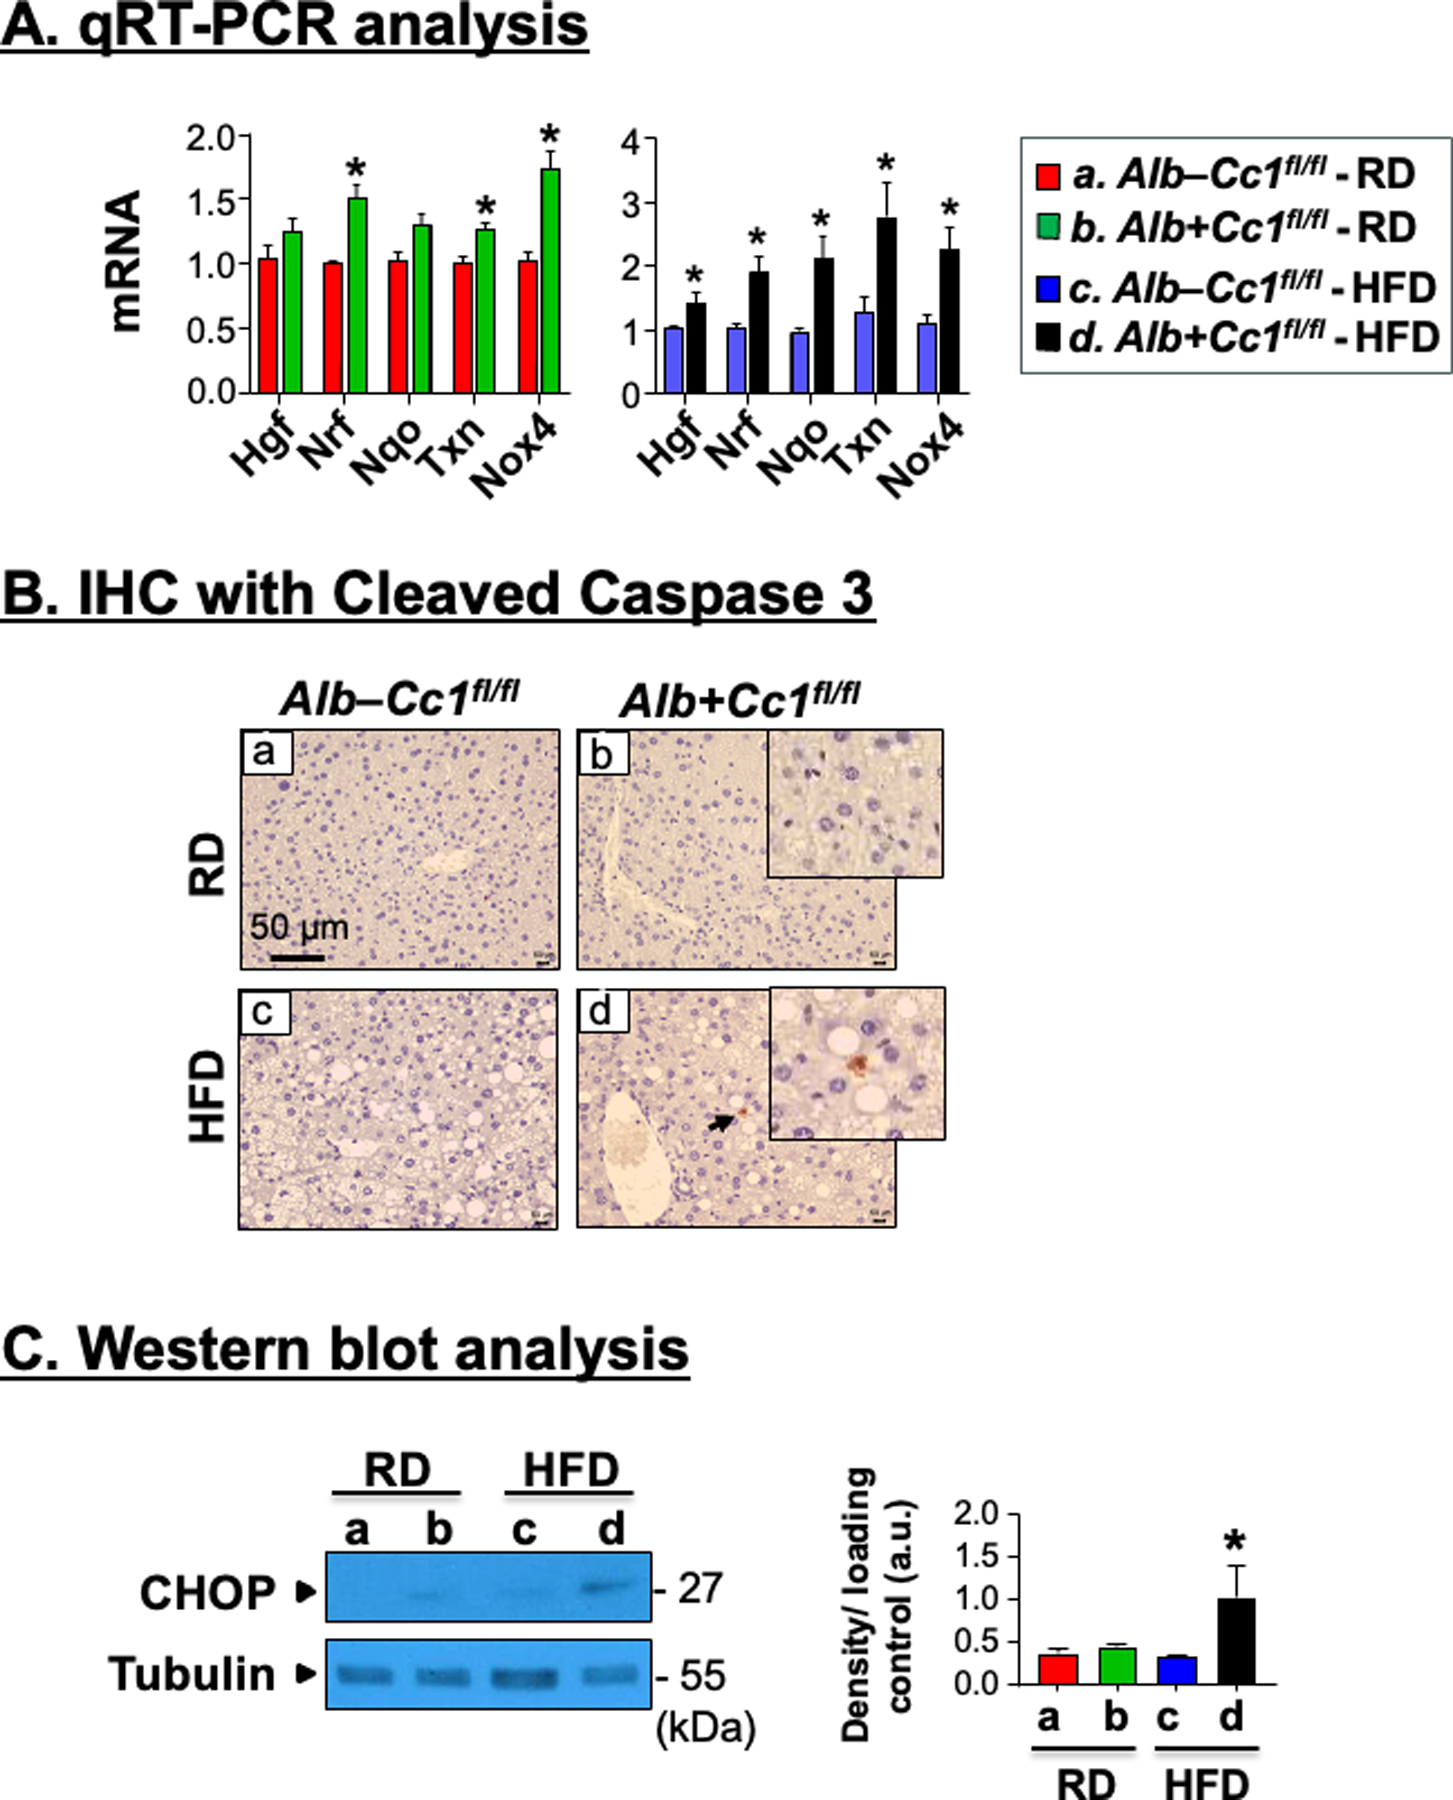
FIGURE 5.

Analysis of hepatic injury and apoptosis. Livers were removed from 8-month-old Alb+Cc1fl/fl mice (n = 6/genotype/feeding group). (A) mRNA analysis of hepatic injury markers in liver tissues normalized to 18s, respectively. Values were expressed as means ± SEM. *P<0.05 vs Alb–Cc1fl/fl. (B) Immunohistochemical analysis of Cleaved Caspase 3 to detect apoptotic cells. Representative images were taken at 50μm magnification and shown with insets for RD- and HFD-fed mutants (panels b and d) at 20μm. (C) Western blot analysis of CHOP normalized against tubulin (total loaded proteins) was performed on liver lysates. Gels were scanned and the density of the test band was divided by that of its corresponding loading control and represented in arbitrary units (a.u) in the accompanying graph. Values were expressed as means ± SEM. *P<0.05 vs Alb–Cc1fl/fl.
