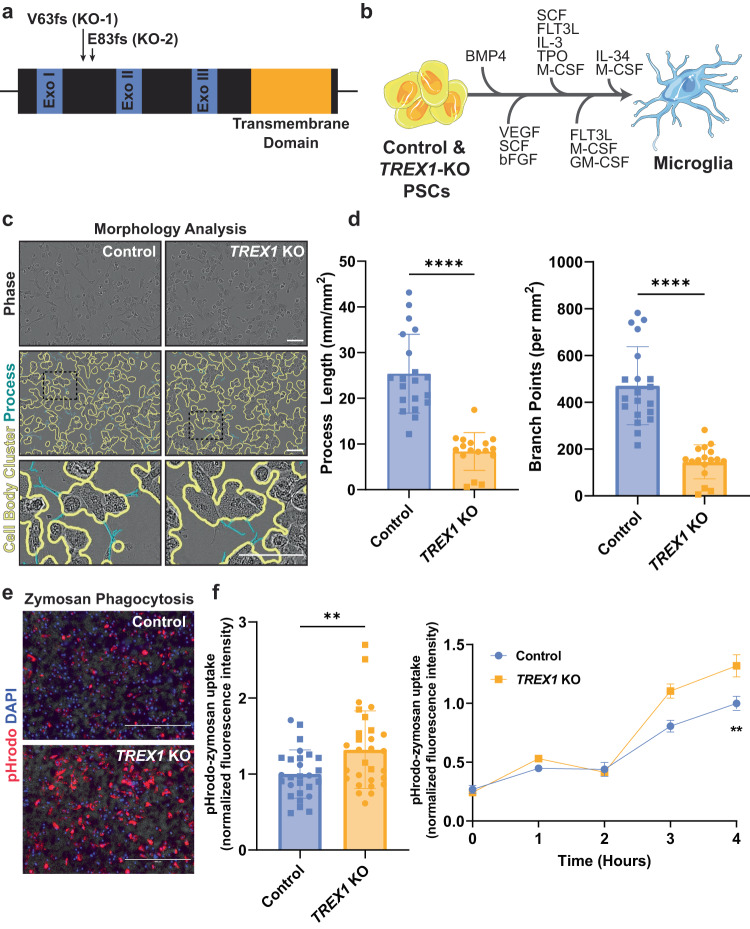
Fig. 1. TREX1-KO microglia demonstrate an active phenotype.
a Schematic representation of the TREX1 gene showing the mutations in the pluripotent lines. “Exo” is short for exonuclease domain. b Schematic representation of the protocol used to differentiate control and TREX1-KO PSCs to microglia-like cells. Full description of the differentiation protocol is in the methods. c Representative brightfield images of microglia-like cells showing an overlay of outlines depicting cell-body clusters and cell processes determined using the Incucyte S3 live-cell analysis system. Scale bar is 100 µm. d Left: Quantification of process length to analyze microglial morphology. Right: Quantification of number of branch points. The presented values are means ± SEM (Control: n = 20 wells; TREX1-KO: n = 17 wells). e Representative images of microglia 4 h post pHrodo-zymosan phagocytosis assay. Scale bars are 400 µm. f Left: Four hour pHrodo-zymosan uptake normalized fluorescence intensity. Right: Line graph of pHrodo-zymosan uptake over 4 h. The presented values are means ± SEM (Control: n = 27 wells; TREX1-KO: n = 29 wells). Symbols in bar graphs indicate cell lines used: circles, Control-1 and TREX1-KO-1 pair; squares, Control-2 and TREX1-KO-2 pair. Colors in graphs represent either the control lines (blue) or the TREX1-KO lines (yellow). *p < 0.05, **p < 0.01, ***p < 0.001, ****p < 0.0001.

