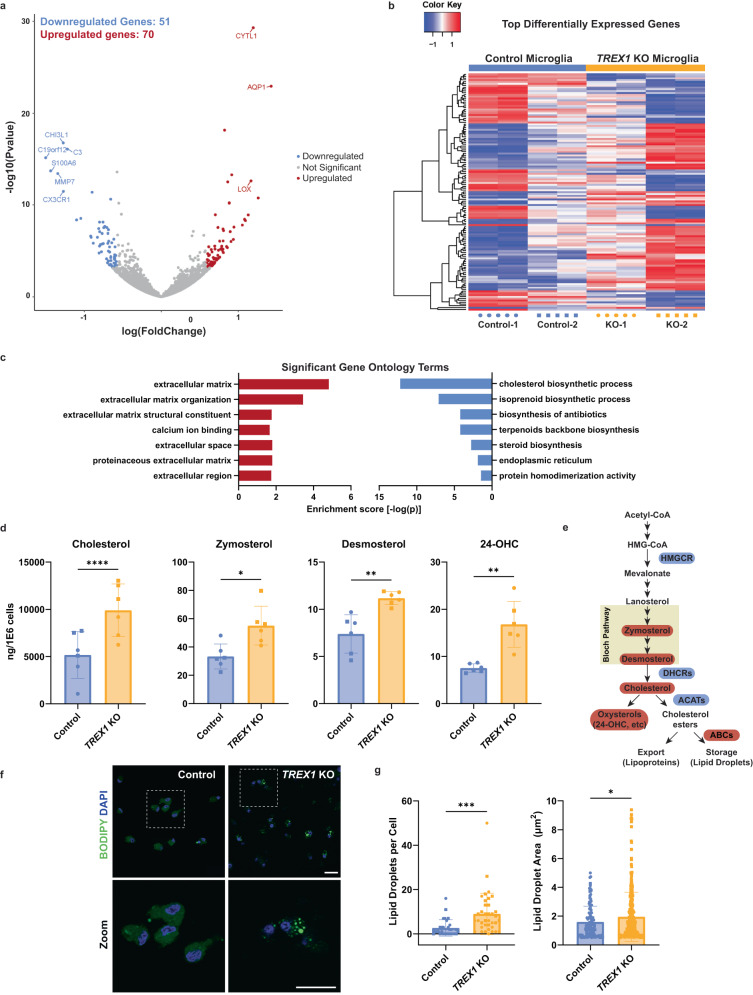
Fig. 2. Cholesterol synthesis is dysregulated in TREX1-KO microglia.
a Volcano plot showing differentially expressed genes between control and TREX1-KO microglia obtained through RNA sequencing. Red dots are genes significantly upregulated in TREX1-KO microglia, blue dots are significantly downregulated genes, and gray dots are not significant. b Heatmap of the top differentially expressed genes between control and TREX1-KO microglia. Red are upregulated genes and blue are downregulated genes. Rows are clustered using the Euclidean distance method. c Bar graph showing the top significant gene ontology terms. Red bars are upregulated in TREX1-KO microglia and blue bars are downregulated. d Total sterol/oxysterol analysis of microglia showing increased zymosterol, desmosterol, and 24-OHC in TREX1-KO microglia. The presented values are means ± SEM (n = 12; 3 independent microglia differentiation experiments and 4 lines). e Simplified schematic of the cholesterol biosynthesis process showing increases (red) in immediate precursors and oxysterol, and changes (blue are downregulated and red are upregulated) in the expression of genes associated with cholesterol enzymes in TREX1-KO microglia. f Representative images of BODIPY-stained microglia. Scale bars are 20 µm. g Left: Quantification of number of lipid droplets per cell. Right: Quantification of lipid-droplet area. The presented values are means ± SEM (n = 60 cells). Symbols in bar graphs indicate cell lines used: circles, Control-1 and TREX1-KO-1 pair; squares, Control-2 and TREX1-KO-2 pair. Colors in graphs represent either the control lines (blue) or the TREX1-KO lines (yellow). *p < 0.05, **p < 0.01, ***p < 0.001, ****p < 0.0001.

