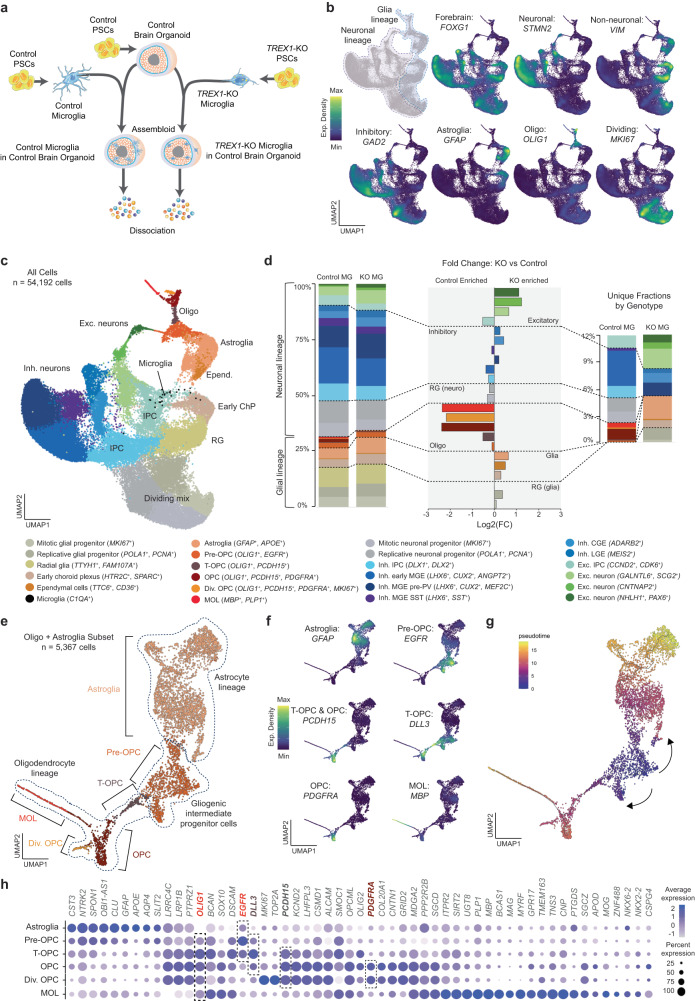
Fig. 4. TREX1 in microglia is necessary for the development of myelinating oligodendrocytes.
a Schematic representation of the assembloid experimental design. Differentiation protocols were performed in parallel prior to combining cells for assembloid generation. b Expression density of selected markers on Uniform Manifold Approximation and Projection (UMAP) plots showing integrated scRNA-Seq from 3 libraries of assembloids composed of control organoids and control microglia and 2 libraries of assembloids composed of control organoids and TREX1-KO microglia (in total, 54,192 cells). c Cell annotations on UMAP plot based on scRNA-seq data. d Left: Percentage distribution of cell types by conditions. Center: Fold change (log2) of percentage distribution between microglia genotype. Right: As in left but showing only unique fractions by microglia genotype. Cells color-coded in all graphs as in (left). The largest difference (by fold change) between microglia genotypes corresponds to oligodendrocyte cell types (MOLs, dividing OPCs, OPCs > t-OPCs > pre-OPCs). The largest differences (by quantity) correspond to a gain of excitatory and astroglia populations and a loss of inhibitory subtypes with mutant microglia. Radial glia with neuronal fate shifted to radial glia with glial fate. e Re-analysis of oligodendrocyte lineage and astroglia on UMAP plot with annotated cell types as indicated. f Expression density of selected markers. g Pseudotime analysis of oligodendrocyte lineage and astroglia starting at pre-OPCs. h Dot plot showing expression of selected marker genes in the five subpopulations of the oligodendrocyte lineage and astroglia. Dot sizes are the percentages of cells in each subpopulation that have detectable expression for the corresponding gene. Most relevant markers highlighted: EGFR primarily for pre-OPC and t-OPC; DLL3 primarily for t-OPC; PDCH15 for OPCs; PDGFRA for OPCs except t-OPCs. All cells express OLIG1. Dot color intensity represents average gene expression. MG: microglia; Oligo: oligodendrocyte; Astro: astrocyte; Micro: microglia; Exc.: excitatory; Inh.: inhibitory; Div.: dividing; RG: radial glia; IPC: intermediate progenitor cells; ChP: choroid plexus; OPC: oligodendrocyte progenitor cells; MGE: medial ganglionic eminence; CGE: caudal ganglionic eminence; LGE: lateral ganglionic eminence; PSCs: pluripotent stem cells.

