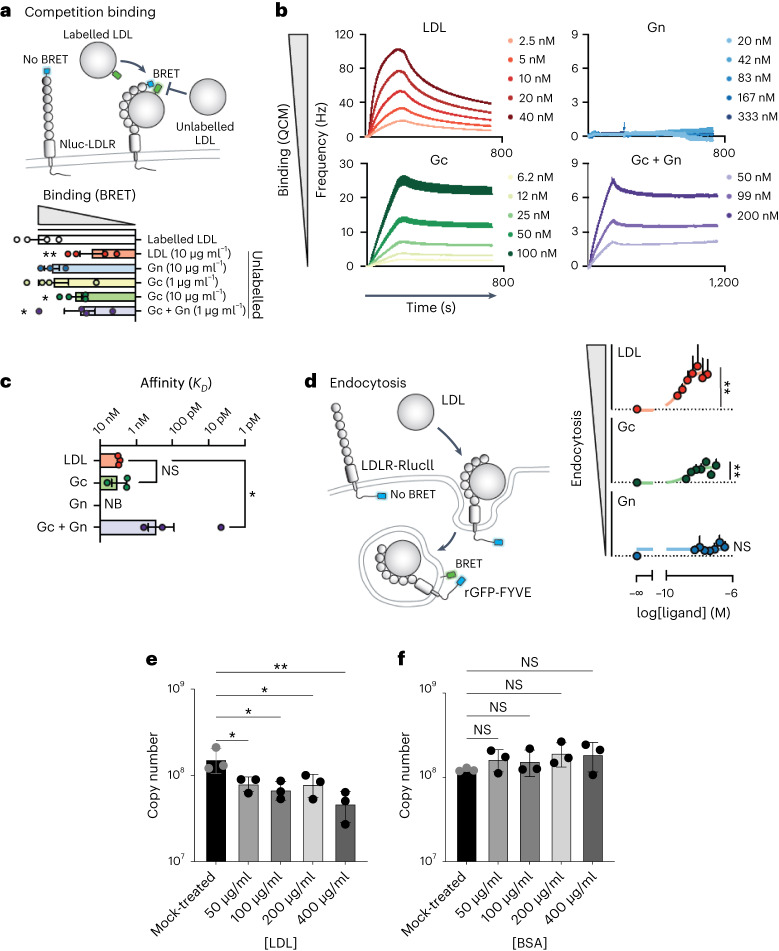
Fig. 2. Binding of CCHFV glycoproteins to LDLR induces receptor-mediated endocytosis.
a, Illustration depicting the BRET-based binding assay that was used to indirectly measure the binding of unlabelled ligand by outcompeting BODIPY-FL labelled LDL for interaction with Nluc-tagged LDLR. BRET between Nluc-LDLR and BODIPY-FL LDL was measured following co-administration with unlabelled LDL, CCHFV Gc, Gn or Gc/Gn, and the AUC was normalized to vehicle treatment. Data are presented as mean ± s.e.m. of n = 4 biologically independent experiments; *P < 0.05, **P < 0.01 (one-way ANOVA with Fisher’s LSD test). b, Kinetic QCM experiments monitoring the interaction between LDL, CCHFV Gc, Gn or Gc/Gn with the extracellular domain of LDLR. Data are presented as mean ± s.e.m. of n = 3 independent experiments. c, Bar graph of the affinities of LDL, CCHFV Gc, Gn or Gc/Gn from QCM experiments. Data are presented as mean ± s.e.m. of n = 3 biologically independent experiments; NB, no binding; *P < 0.05 (Kruskal–Wallis test with uncorrected Dunn’s test). d, Schematic of the internalization assay to assess the ligand-dependent accumulation of LDLR at early endosomes. Cells expressing LDLR-RlucII (donor) and rGFP-FYVE (acceptor) were stimulated with vehicle or increasing concentrations of LDL, recombinant CCHFV Gc or recombinant CCHFV Gn for 45 min before BRET measurements. Data are presented as mean ± s.e.m. (n = 3 independent experiments). Binding and internalization were assessed by comparing the top and bottom parameters from nonlinear regression in the extra sum-of-squares F-test (P < 0.05). **P < 0.01; one-tailed extra sum-of-squares F-test. e, Competition assay between CCHFV and LDL in SW13 cells (MOI 0.01, 24 h.p.i.). f, BSA was used as control. Data are represented as mean ± s.d. of n = 3 independent experiments. P values were calculated using one-way ANOVA. *P < 0.05, **P < 0.01; NS P > 0.05. Exact P values are available in.

