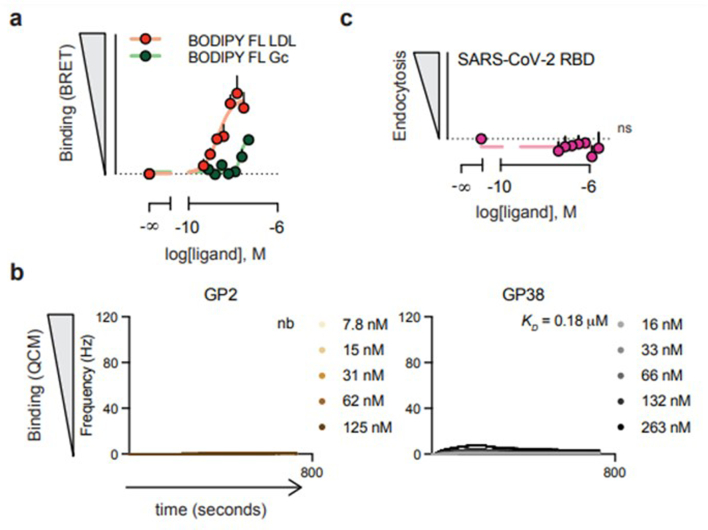
Extended Data Fig. 3. Additional measures of ligand selectivity at LDLR and controls for BRET and QCM experiments.
a, Cells expressing Nluc-LDLR (donor) were stimulated with vehicle or increasing concentrations of BODIPY-FL-labelled LDL or Gc (acceptor) for 90 min during which the BRET was measured continuously. Data are represented as the mean area under the curve ± SEM (n = 5 biologically independent samples). b, Kinetic QCM experiments monitoring the interaction between G2 (Toscana virus) or GP38 with the extracellular domain of LDLR. Data are presented as mean ± s.e.m. of n = 3 independent experiments. c, SARS-CoV-2 RBD does not induce internalization of LDLR. Data are represented as the mean ± SEM (n = 3). Binding and internalization were assessed by comparing the top and bottom parameters from non-linear regression in the extra sum-of-squares F-test (P < 0.05). ns non-significant (one-tailed extra sum-of-squares F test).

