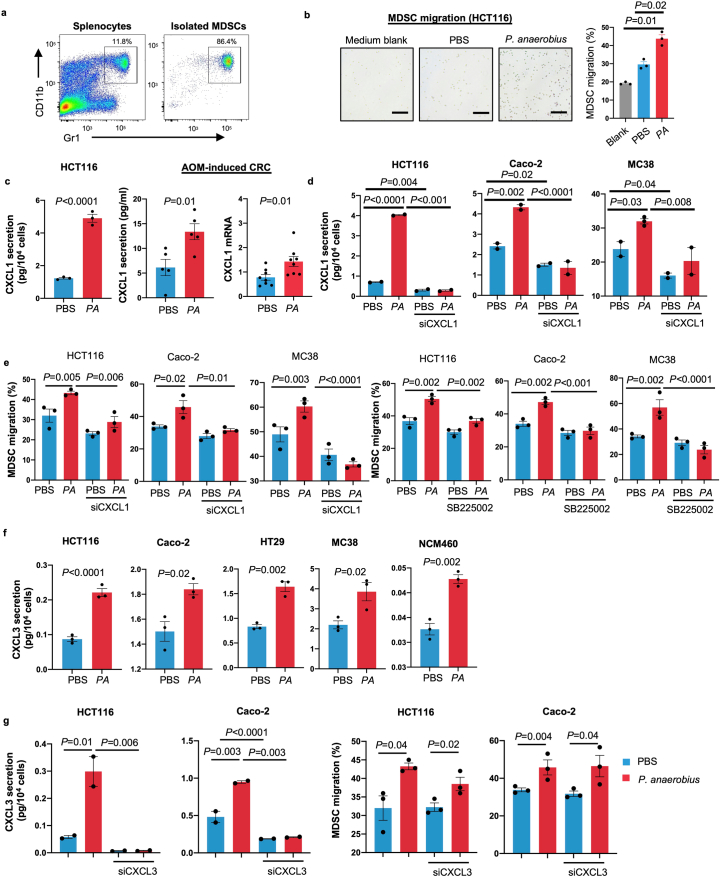
Extended Data Fig. 4. P. anaerobius induced CXCL1 secretion in tumour cells to promote MDSC migration.
a. The CD11b+Gr-1+ cell content of the isolated fraction from spleen of MC38-bearing C57BL/6 mice. b. Representative images of MDSCs migrated to the lower chamber and quantification of MDSC migration towards conditioned medium from HCT116 cells pre-incubated with vehicle or P. anaerobius. Scale bar: 100 μm. c. Quantification of CXCL1 secretion from HT29, induced by P. anaerobius using ELISA (n = 3 in each group) and Quantification of serum CXCL1 (pg/ml) in AOM-injected mice (n = 5 in each group). mRNA expression of CXCL1 in the colon of AOM-injected mice (n = 8 in each group). d. CXCL1 secretion from HCT116, Caco-2 and MC38 cell lines pretreated with P. anaerobius or PBS with or without CXCL1 knockdown (n = 2 biologically independent samples). e. P. anaerobius -promoted MDSC migration in conditioned medium of HCT116 cells was abolished by CXCL1 knockdown (left), or SB225002 (CXCR2 antagonist) treatment (right) (n = 3 biologically independent samples). f. Quantification of CXCL3 secretion from HCT116, Caco-2, HT29, MC38, NCM460 induced by P. anaerobius using ELISA (n = 3 in each group). g. CXCL3 secretion (n = 2 in each group) and MDSC migration (n = 3 in each group) rate induced by HCT116 and Caco-2 pretreated with P. anaerobius or PBS with or without CXCL3 knockdown. Data are presented as mean ± SEM. P values were calculated by one-way ANOVA followed by Tukey’s post-hoc test (b, d, e, g), unpaired two-tailed Student’s t-test (c, f).

