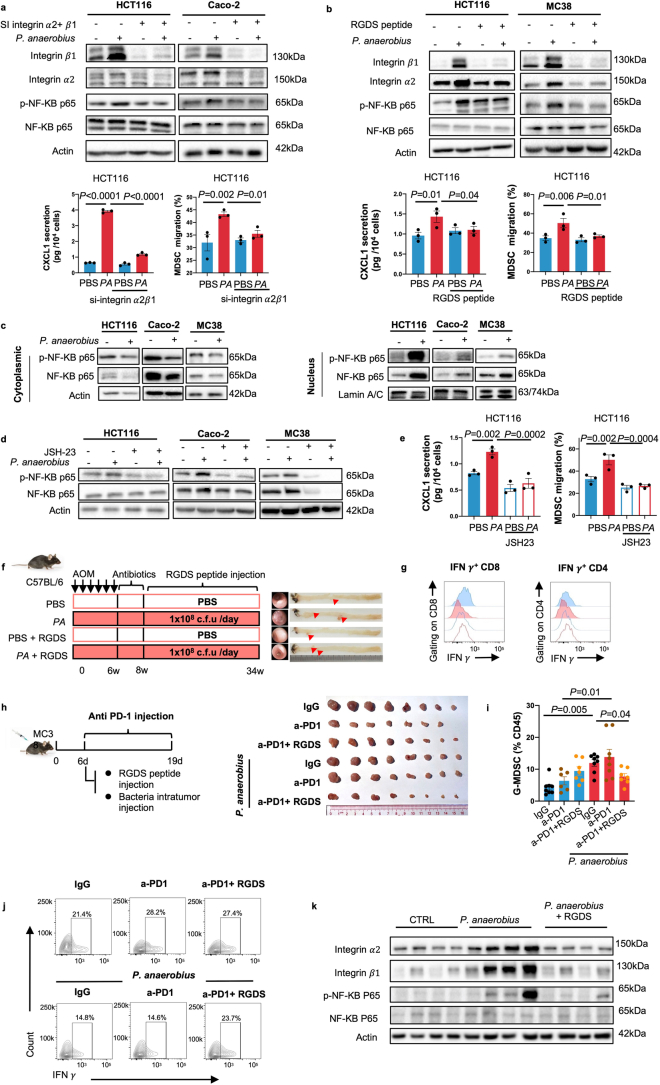
Extended Data Fig. 5. P. anaerobius activates the NF-κB pathway though interactiong with integrin α2/β1 on cancer cells.
a. Validation of integrin α2/β1 knock down efficiency by western blot in HCT116 and Caco-2 cells (up) and Integrin α2β1 knockdown in HCT116 cells abrogated P. anaerobius-induced CXCL1 secretion and migration of MDSCs (down). b. Antibody blocking of integrin α2/β1 suppressed P. anaerobius-induced NF-κB activation in HCT116 and MC38 cells (up) and RGDS peptide treatment in HCT116 cells abrogated P. anaerobius-induced CXCL1 secretion and migration of MDSCs (down). a-b n = 3 biologically independent samples. c. P. anaerobius promoted the nuclear translocation of NF-κB p65 and phospho-p65 in CRC cells. d. Induction of NF-κB activation by P. anaerobius was abolished by JSH-23 in HCT116, Caco-2 and MC38 cells. Three independent experiments were repeated with similar results in a–d. e. Treatment with JSH-23 abolished P. anaerobius -induced CXCL1 secretion (left) and MDSCs migration (right) in conditioned medium from HCT116 cell (n = 3 biologically independent samples). f. Schematic diagram of RGDS treatment in mice. RGDS abrogated P. anaerobius-induced colorectal tumorigenesis. g. Representative flow plots of IFNγ+CD8+T cells and IFNγ+CD4+T cells in colonic LP cells. h. Schematic diagram of MC38 allograft model. RGDS peptide reversed P. anaerobius -mediated anti-PD1 resistance in MC38 allografts. Representative images of tumours after sacrificing. i. Percentage of G-MDSCs in tumours were determined by flow cytometry analysis. 6-8 mice were used in each group including IgG (n = 8), a-PD1 (n = 6), a-PD1 + RGDS (n = 7), PA+ IgG (n = 8), PA+ a-PD1 (n = 8), PA+ a-PD1 + RGDS (n = 7). j. Representative tumour flow plots of IFNγ+CD8+T cells in tumours. k. Integrin α2/β1 blockade abolished the effect of P. anaerobius on NF-κB pathway in MC38 allograft tumours (n = 4 biologically independent samples). Data are presented as mean ± SEM. P values were calculated by one-way ANOVA followed by Tukey’s post-hoc test (e, i).

