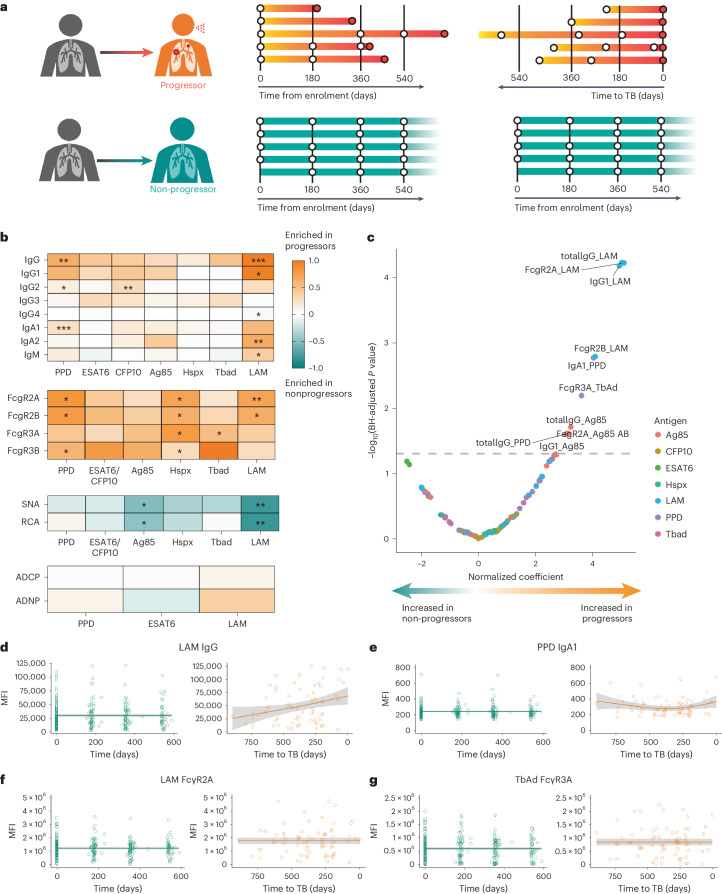
Fig. 1. ACS progressors exhibit distinct Mtb-specific antibody profiles.
a, Serum collected longitudinally from a cohort of South African adolescents who later progressed to active TB disease (n = 36) or who maintained asymptomatic infection (n = 104). For analyses in the current study, progressors were aligned by time of diagnosis and non-progressors by time of enrolment. b, Systems serologic assays performed against a panel of Mtb antigens, including the selection of antibody isotype and subclasses, the binding of Fcγ receptors, the binding to Fc of lectins SNA (recognizes sialic acid) and RCA (recognizes galactose), and the ability to recruit antibody-mediated cellular phagocytosis (ADCP) and neutrophil phagocytosis (ADNP). For each indicated assay, values for each individual were averaged over time. Each heatmap represents log2(median value in progressors/median value in non-progressors). The statistical significance of the differences between progressors and non-progressors was measured by two-sided Mann–Whitney test followed by Benjamini–Hochberg (BH) correction for multiple comparisons. *P < 0.05; **P < 0.01. c, Mixed-effects linear modelling to evaluate the association between antibody features and progressor status by controlling age, sex, ethnicity, school code and time of sample collection. Likelihood ratio test was used to compare the two paired models, and P values were corrected for multiple comparisons by the BH method. The x axis indicates the effect size as a normalized coefficient of the variable of progression, and the y axis −log10 of the adjusted P values. The dotted line represents the corrected P value of 0.05. d, Raw values of LAM-specific IgG measurements for all individuals plotted over time from enrolment (non-progressors, teal) or time to TB (progressors, orange). The solid lines indicate a smooth of median values, using a generalized additive model, and the grey shading indicates one standard deviation. e–g, Plots for PPD-specific IgA1 (e), LAM-specific antibody binding of FcγR2A (f) and TbAd-specific antibody binding of FcγR3A (g).

