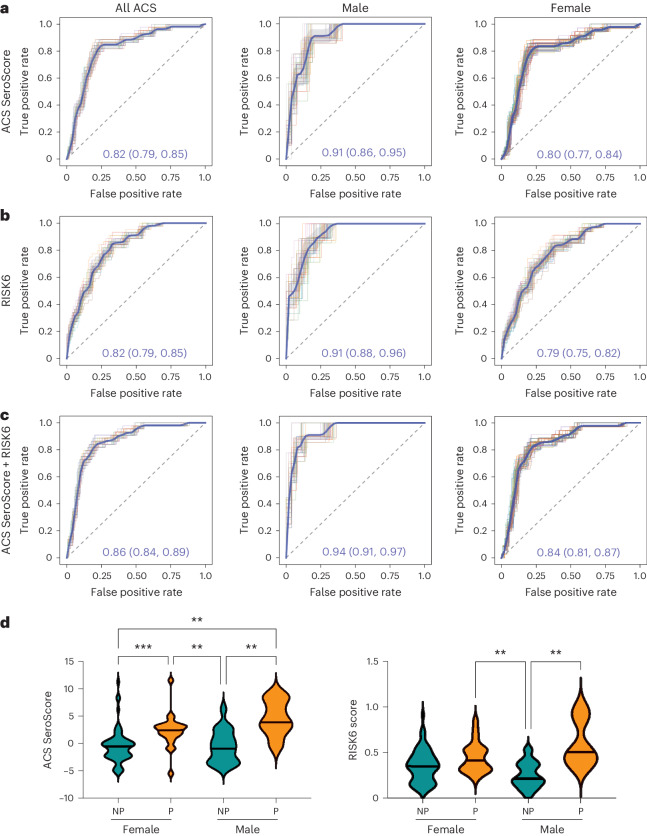
Fig. 3. Sex modulates the association of SeroScore and RISK6 with TB progression.
ROC curves were developed measuring the ability of the ACS-derived SeroScore and RISK6 to differentiate progressors from non-progressors in ACS. a, The identification of progressors by the ACS-derived SeroScore among all ACS individuals (n = 29 progressors and n = 99 non-progressors), males only (n = 7 progressors and n = 37 non-progressors) and females only (n = 22 progressors and n = 63 non-progressors). b, As in a, the performance of RISK6 among all ACS, males only and females only. c, The identification of progressors by the ACS-derived SeroScore and RISK6 in combination among all ACS, males only and females only. For a–c, the mean of 50 curves is shown in blue, with grey shading indicating one standard deviation. The mean AUC with 95% confidence interval is indicated on each plot. d, The ACS SeroScore and RISK6 signature score were plotted for female (n = 22) and male (n = 7) progressors (P, orange) and female (n = 63) and male (n = 37) non-progressors (NP, teal) from ACS. The groups were compared by Kruskal–Wallis test, with P values <0.05 indicated.

