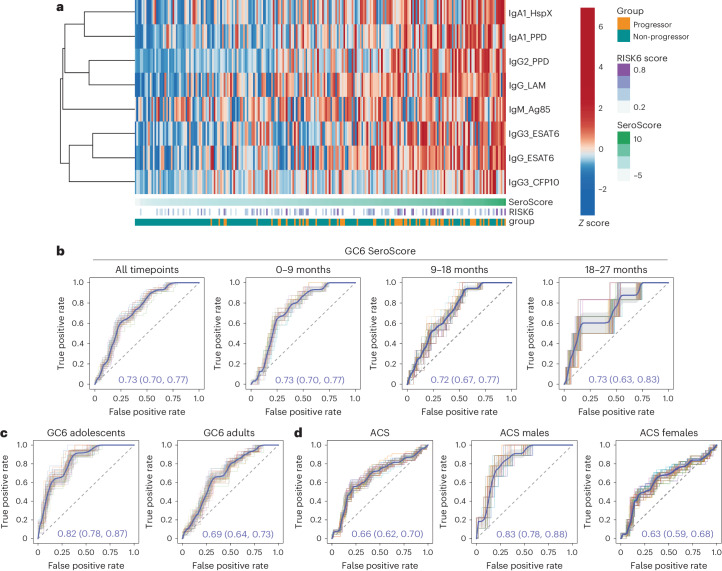
Fig. 5. A GC6-derived SeroScore detects humoral correlates of progression.
a, A multivariate SeroScore was developed in GC6. The heatmap represents Z-scored data for the six features included in the SeroScore. Each column represents one individual (n = 39 progressors and n = 169 non-progressors). The individuals are sorted by overall SeroScore as shown in the track beneath the heatmap. The RISK6 score and progressor/non-progressor status of each individual are also indicated in tracks. b, To evaluate the ability of the GC6-derived SeroScore to identify progressors in the same cohort, ROC curves were developed over the total study period (n = 39 progressors, n = 169 non-progressors) and for progressors in time windows 0–9 months (n = 30 progressors), 9–18 months (n = 19 progressors) and 18–27 months (n = 8 progressors) before the diagnosis of active TB. The mean of 50 curves is shown in blue, with grey shading indicating one standard deviation. The mean AUC with 95% confidence interval is indicated. c, ROC curves measure the ability of the GC6-derived SeroScore to identify GC6 progressors in an age-stratified analysis of adolescents (n = 14 progressors and n = 63 non-progressors) and adults (n = 25 progressors and n = 106 non-progressors). d, The ROC curves measure the ability of the GC6-derived SeroScore to identify progressors in the full ACS cohort (n = 29 progressors and n = 99 non-progressors), males only (n = 7 progressors and n = 37 non-progressors) and females only (n = 22 progressors and n = 63 non-progressors).

