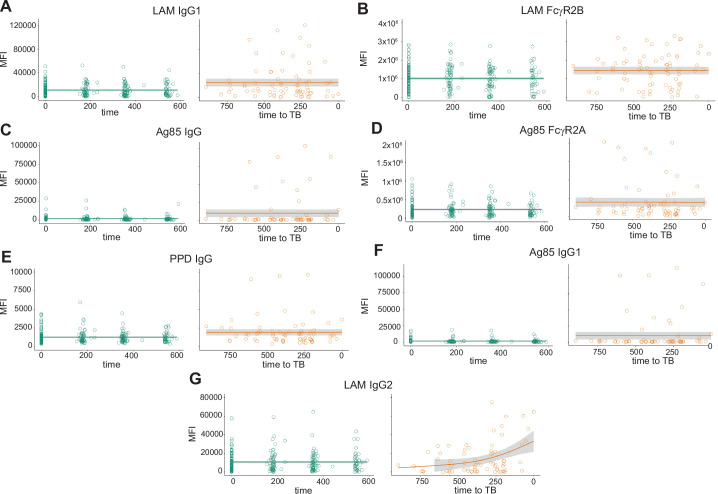
Extended Data Fig. 1. Temporal trajectories of additional Mtb-specific antibody features significantly enriched in ACS progressors.
Raw values of measured antibody features for all indivduals were plotted over time from enrollment (non-progressors, teal) or time to TB (progressors, orange). Solid lines indicate a smooth of median values, using a generalized additive model, and grey shading indicates 95% confidence interval. Data is shown for a) LAM IgG1, b) LAM FcgR2B, c) Ag85 IgG, d) Ag85 FcgR2A, e) PPD IgG, f) Ag85 IgG1, and g) LAM IgG2. These include all antibody features found to statistically differ between progressors and non-progressors in mixed effects linear modeling, as well as LAM IgG2, which did not statistically differ but is shown for comparison.

