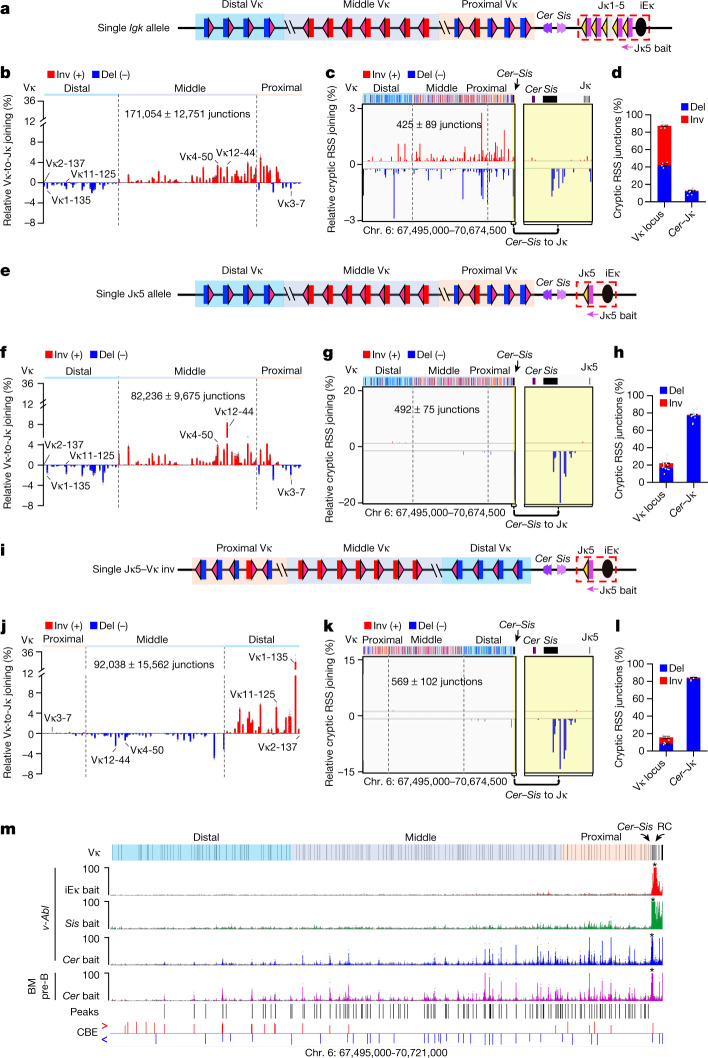
Fig. 2. RAG scanning for primary Igk rearrangement is terminated within Sis while Cer interacts across the Vκ locus.
a, Diagram of the single Igk allele v-Abl line. b, Relative utilization of individual Vκ segments in the single Igk allele line with Jκ5 bait. c, Percentage of pooled RAG off-target junctions in Igk locus from the single Igk allele line. The region between Cer and Jκ, highlighted in yellow, is enlarged on the right. d, Percentage of inversional and deletional cryptic RSS junctions within indicated Vκ locus (chromosome (chr.) 6:67,495,000–70,657,000) and Cer–Jκ regions (chr. 6:70,657,000–70,674,500) from the single Igk allele line. e, Diagram of the single Jκ5 allele v-Abl line. f–h, Vκ usage (f) and RAG off-target profiles (g,h) in the single Jκ5 allele line presented as in b–d. i, Diagram of the single Jκ5-Vκ inv v-Abl line. j–l, Vκ usage (j) and RAG off-target profiles (k,l) in the single Jκ5-Vκ inv line presented as in b–d. Vκ1-135 is over-utilized (j), probably owing to its associated transcription. In Fig. 1e,f, Vκ2-137 is equally used, probably owing to its replacement of primary Vκ1-135 inversional rearrangements via deletional secondary rearrangements. Vκ usage data and RAG off-target junctions in the inverted locus are shown in inverted orientation (j,k). m, Chromosome conformation capture (3C)-HTGTS profiles in the Igk locus from RAG-deficient v-Abl cells baiting from iEκ (red), Sis CBE2 (green) and Cer CBE1 (blue) and from RAG-deficient primary pre-B cells baiting from Cer CBE1 (pink). Asterisks indicate the location of baits. Locations of Cer-baited interaction peaks in the Vκ locus significantly above background are indicated with black lines, CBEs in the Igk locus are indicated with red (rightward) and blue (leftward) lines. Details on peak calling are provided in Methods. Vκ utilization and cryptic RSS data are presented as mean ± s.e.m. from 4 (b,d), 7 (f,h) or 3 (j,l) biological repeats; 3C-HTGTS data are presented as mean value from 2 biological repeats.

