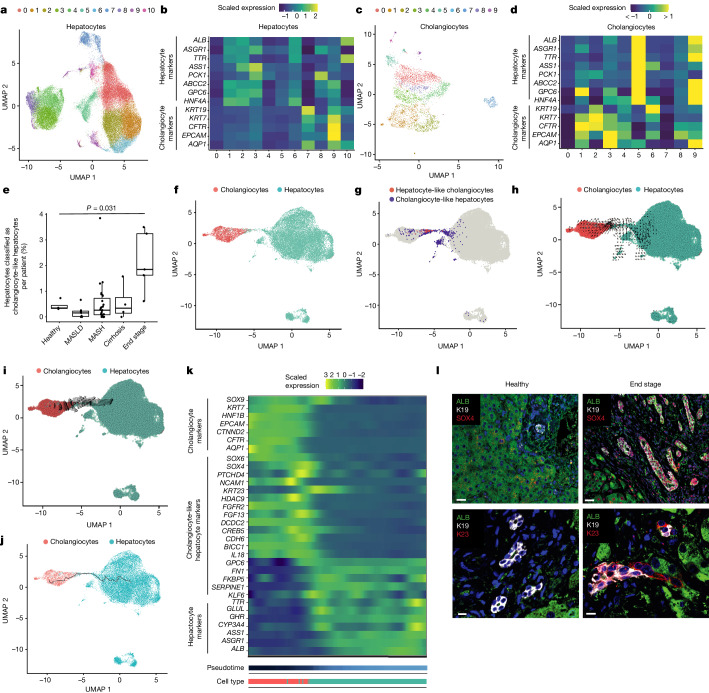
Fig. 3. Using snRNA-seq identifies cholangiocyte and hepatocyte plasticity.
a, Subclustering of hepatocytes. b, Relative expression of hepatocyte and cholangiocyte markers across hepatocyte subclusters. c, Subclustering of cholangiocytes. d, Relative expression of hepatocyte and cholangiocyte markers across cholangiocyte subclusters. e, Proportion of hepatocytes classified as cholangiocyte-like hepatocytes (identified by subclustering hepatocyte cluster 9 in b) that are expressing cholangiocyte markers, by disease stage. Statistical significance was calculated using two-sided Welch’s t-test (n = 47 biologically independent donors: healthy, 4; NAFLD, 7; NASH, 27; cirrhosis, 4; end stage, 5). The P value was 0.03058 (significant under a 0.05 threshold). The mid-point, minimum and maximum of the boxplot summary correspond to the median, first and third quartiles. The extent of the whiskers corresponds to the largest and smallest values no further than 1.5 IQR from the inter-quartile range. f, UMAP of cholangiocytes and hepatocytes from end-stage MASLD disease only. g, Cholangiocyte-like hepatocytes and hepatocyte-like cholangiocytes (identified by subclustering hepatocyte cluster 9 in b and subclustering cholangiocyte cluster 1 in d, respectively) that express hepatocyte markers are plotted to show their location on the UMAP. h, RNA velocity using cholangiocyte-like hepatocytes. i, RNA velocity using hepatocyte-like cholangiocytes. j, Pseudotime trajectory across the connected region of the two cell types. k, Heat map of DEGs (differentially expressed genes) across the trajectory. l, Immunofluorescence staining of the cholangiocyte-like hepatocyte markers SOX4 and K23 alongside ALB and K19 in healthy and end-stage sections; n = 3 healthy and n = 3 end-stage tissue samples. Scale bars: 30 μm in the SOX4 images (top); 10 μm in the K23 images (bottom).

