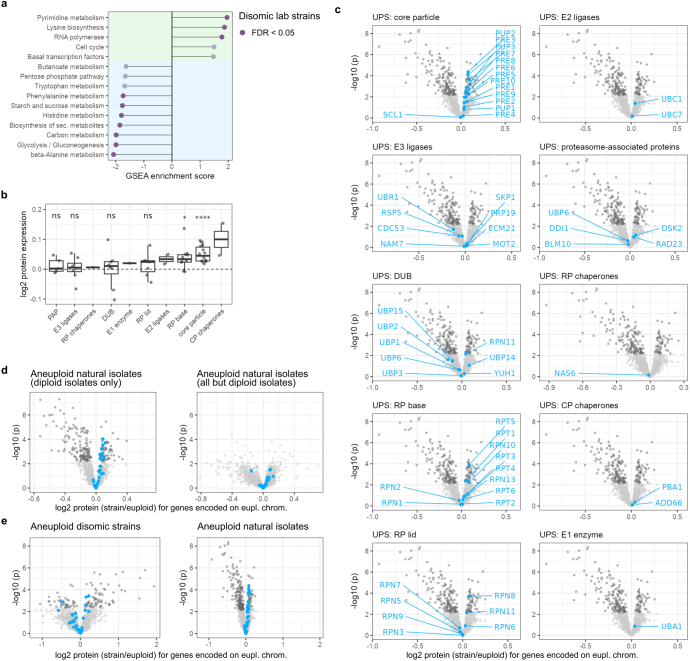
Extended Data Fig. 5. Enrichment of structural components of the proteasome in aneuploid natural isolates.
a, GSEA of median log2 protein expression ratios (strain/euploid) of genes encoded on euploid chromosomes across all disomic strains. Statistically significant enrichment scores (FDR < 0.05) are coloured in purple (protein). b, Median relative expression of UPS components on euploid chromosomes in aneuploid natural S. cerevisiae isolates. The adjusted p-values (Benjamini–Hochberg-corrected) of one-sample, two-sided t-tests comparing the mean of each group to the expected mean expression of UPS components in euploid isolates (µ = 0) are shown above the box plots (core particle: p = 0.000053; RP base: p = 0.044; ns: p > 0.05). In box plots, the centre marks the median, hinges mark the 25th and 75th percentiles and whiskers show all values that, at maximum, fall within 1.5 times the interquartile range. c, Components of the UPS and their regulation in aneuploid isolates (trans expression). Volcano plots show the results of one-sample, two-sided t-tests comparing the mean log2 protein ratios of proteins expressed on euploid chromosomes of 95 aneuploid isolates to μ = 0. Proteins with statistically significant differential expression after multiple hypothesis correction (Benjamini–Hochberg) are coloured in dark grey. Components of the UPS are highlighted and labelled as blue dots in separate panels. d, Volcano plots showing results of one-sample, two-sided t-tests as in Fig. 4c, but for all diploid natural isolates (n = 73, left panel), or all isolates but diploid isolates (n = 22, right panel). e, Volcano plots as in Fig. 4c, but with the x and y axes scaled to match.

