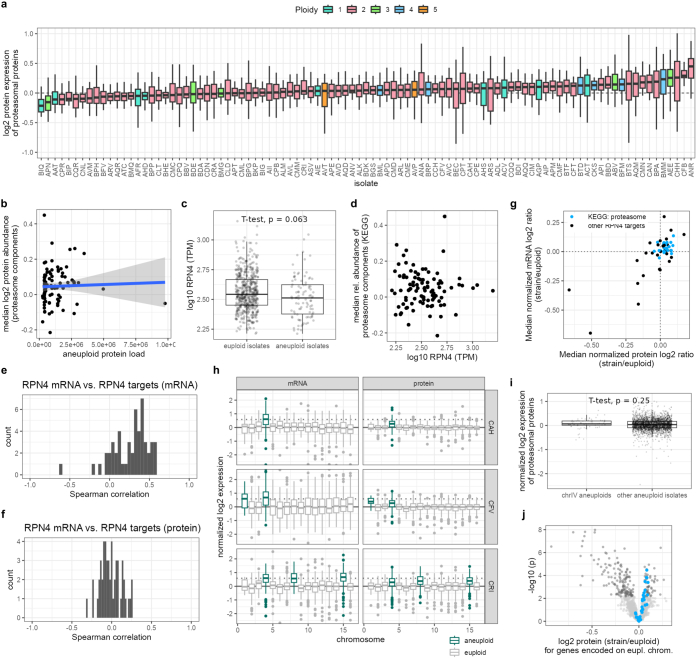
Extended Data Fig. 6. Regulation of proteasome abundance.
a, Relative expression of proteasomal proteins (KEGG term “Proteasome”) on chromosomes trans to aneuploid chromosomes in natural S. cerevisiae isolates (BMM: n = 16; CRI: n = 19; BMQ: n = 20; BML, CKS: n = 24; AVC: n = 25; AEE: n = 26; ADL, CAH, CFV: n = 27; AQD, AVT, BFM, CFT, CHH: n = 28; ALK, API, AQM: n = 29; ANV, BBD, BIP, BKP, BPA, CCH, CPR: n = 30; ABV, AGP, AHS, AIE, AIP, ALM, ANA, APD, APE, APM, AQQ, AQR, ASV, ATC, AVD, AVM, BEC, BFV, BGS, BTD, BTF, BTS, CAN, CFB, CIM, CLT, CMD, CME, CPQ, CPT: n = 31; all other isolates: n = 32 proteins). The box plots are coloured by the basal ploidy of the isolates. The y-axis is shown for log2 protein ratios between −1 and 1 to improve readability. b, Relationship between relative abundance of proteasomal proteins (KEGG term “Proteasome”) in natural yeast isolates and the aneuploid protein load (blue line: linear model, grey bands: 95% confidence interval). c, Comparison of RPN4 mRNA levels in aneuploid (n = 95) versus euploid isolates (n = 518) of the integrated dataset. The displayed p-value (p = 0.063) is derived from a two-sample, two-sided t-test between euploid and aneuploid data points. d, Relationship between the median abundance of proteasome components (KEGG term “Proteasome”) in natural aneuploid isolates (black dots) and RPN4 mRNA levels (TPM: transcripts per million). No correlation is observed. e,f, Distribution of Spearman correlation coefficients for the correlation between RPN4 mRNA levels and either RPN4 target mRNA levels (e) or RPN4 target protein levels (f) expressed in trans, so on euploid chromosomes in natural aneuploid isolates (n = 95). Correlation coefficients are higher for RPN4 target mRNA levels than for RPN4 target protein levels. g, Regulation of RPN4 targets at the protein and mRNA level in natural aneuploid isolates. The median expression level per gene across all isolates that express the gene in trans to aneuploid chromosomes is shown. Structural components of the proteasome are highlighted in blue, other RPN4 targets are black. h–j, RPN4 is located on chromosome 4. We assessed whether natural isolates carrying a chromosome 4 aneuploidy show particularly prominent induction of the proteasome due to increased gene dosage of RPN4. h, Box plots showing log2 mRNA and protein expression sorted by chromosome (chr. 1: n = 18; chr. 2: n = 106; chr. 3: n = 41; chr. 4: n = 186; chr. 5: n = 89; chr. 6: n = 30; chr. 7: n = 148; chr. 8: n = 70; chr. 9: n = 48; chr. 10: n = 94; chr. 11: n = 96; chr. 12: n = 140; chr. 13: n = 134; chr. 14: n = 109; chr. 15: n = 140; chr. 16: n = 114 genes per chromosome) for the three isolates (CAH, CFV, CRI; all diploid) of the integrated dataset that carry an aneuploidy of chromosome 4. The aneuploid chromosomes are highlighted for each isolate. The grey dotted line indicates 0.58 – the expected attenuated relative expression level for mRNAs or proteins encoded on trisomic chromosomes in diploid isolates. Relative expression values are shown between −2.5 and 2.5. i, Comparison of upregulation of proteasomal proteins (KEGG term “Proteasome”, two-sample, two-sided T-test, chromosome 4: n = 73 proteins; other aneuploid isolates: n = 2809, p = 0.25) that are expressed in trans to aneuploid chromosomes in natural isolates that carry an aneuploidy of chromosome 4 (3 isolates) versus all other natural aneuploids (92 isolates). j, Volcano plot for all natural aneuploid isolates except for the three isolates carrying an aneuploidy of chromosome 4 (n = 92) showing results of one-sample, two-sided t-tests comparing the mean log2 protein ratios to μ = 0. Proteins with statistically significant differential expression after multiple hypothesis correction (Benjamini–Hochberg) are coloured in dark grey. Structural components of the proteasome are highlighted in blue. In box plots, the centre marks the median, hinges mark the 25th and 75th percentiles and whiskers show all values that, at maximum, fall within 1.5 times the interquartile range.

