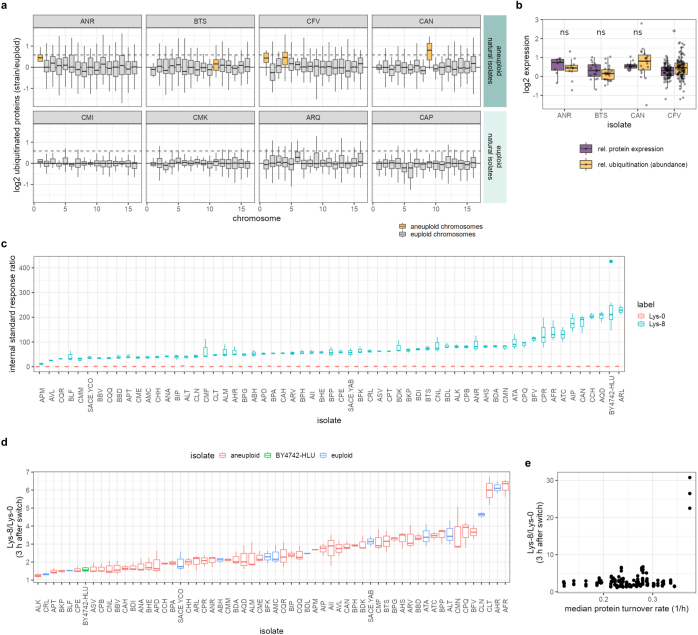
Extended Data Fig. 7. Ubiquitinomics and lysine uptake of natural isolates.
a, Chromosome-wide distributions of the relative abundance of ubiquitinated proteins quantified by diglycine remnant profiling in aneuploid and euploid natural isolates. Proteins carrying ubiquitin side chains were used to determine normalized log2 protein abundance ratios (comparing the expression of each gene per isolate with the median expression of the respective gene across the four euploid isolates). Aneuploid chromosomes are highlighted in yellow, euploid chromosomes are coloured grey (chr. 1: 7 <= n <= 11; chr. 2: 42 <= n <= 72; chr. 1: 13 <= n <= 22; chr. 4: 62 <= n <= 112; chr. 4: 36 <= n <= 58; chr. 6: 11 <= n <= 18; chr. 7: 62 <= n <= 88; chr. 8: 24 <= n <= 44; chr. 9: 12 <= n <= 25; chr. 10: 29 <= n <= 52; chr. 11: 23 <= n <= 43; chr. 12: 56 <= n <= 81; chr. 13: 44 <= n <= 76; chr. 14: 32 <= n <= 64; chr. 15: 53 <= n <= 77; chr. 16: 40 <= n <= 64 proteins per chromosome). Outliers are not shown to improve readability of the distributions. The solid and dotted horizontal lines mark 0 and 0.58, respectively. b, Comparison of relative protein expression (purple) and ubiquitination (as in a, yellow) levels of proteins encoded on aneuploid chromosomes in four natural isolates. Statistical significance of two-sample, two-sided t-test between relative protein expression and relative ubiquitination per isolate is indicated (ns: p > 0.05, *: p = 0.018). c, Ratio (internal standard response ratio) between unlabelled (Lys-0, red) or labelled (Lys-8, cyan) intracellular lysine and an internal quantification standard (Lys-4, Methods) in prototroph natural isolates and a lysine-auxotroph laboratory strain (BY4742-HLU) after continuous growth in minimal medium (SM) supplemented with 80 mg/L labelled lysine (Lys-8). d, Ratio between labelled and unlabelled intracellular lysine (Lys-8/Lys-0) in prototroph natural isolates and a lysine-auxotroph laboratory strain (BY4742-HLU) three hours after switching from growth in unlabelled (SM + 80 mg/L Lys-0) to labelled (SM + 80 mg/L Lys-8) medium. Aneuploid (red) and euploid (blue) natural isolates, as well as the lab strain (green) are highlighted. For c and d, n = 2 for ATC, n = 6 for BY4742-HLU, n = 3 biological replicates for all other isolates. e, The relationship between Lys-8/Lys-0 ratios from d and the median protein turnover rate per isolate (black dots) shows no correlation. In box plots, the centre marks the median, hinges mark the 25th and 75th percentiles and whiskers show all values that, at maximum, fall within 1.5 times the interquartile range.

