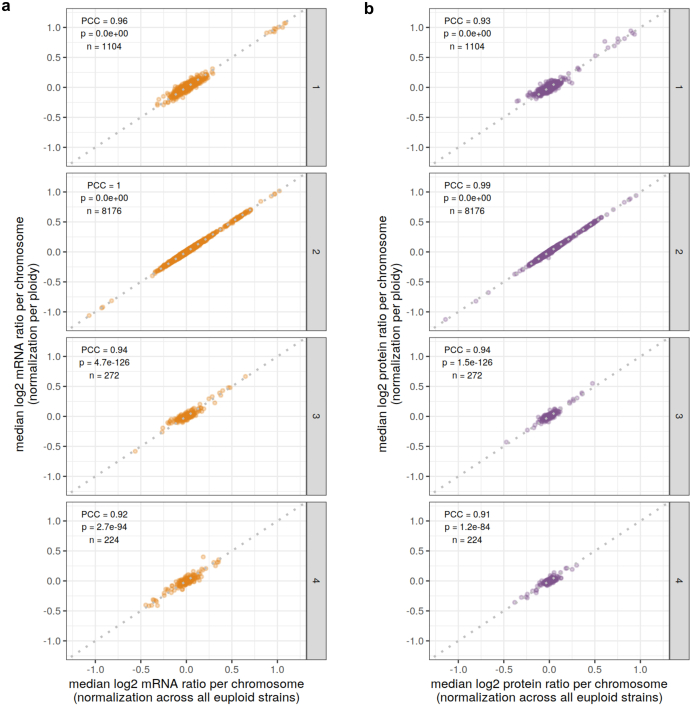
Extended Data Fig. 9. Comparison of all-euploid isolate versus ploidy-wise normalization procedures.
a,b, Pearson correlation coefficients (PCC) between the different normalization procedures were determined per ploidy (haploid to tetraploid, vertical panels) for median chromosomal log2 mRNA (a, orange dots) or log2 protein (b, purple dots) expression values. Euploid and aneuploid isolates were included in the analysis. The number of chromosomes per ploidy, so the number of data points included in the correlation analysis, is denoted by n, and p refers to the p-value of the two-sided correlation test. The grey dotted line indicates a correlation of 1 (y = x).

